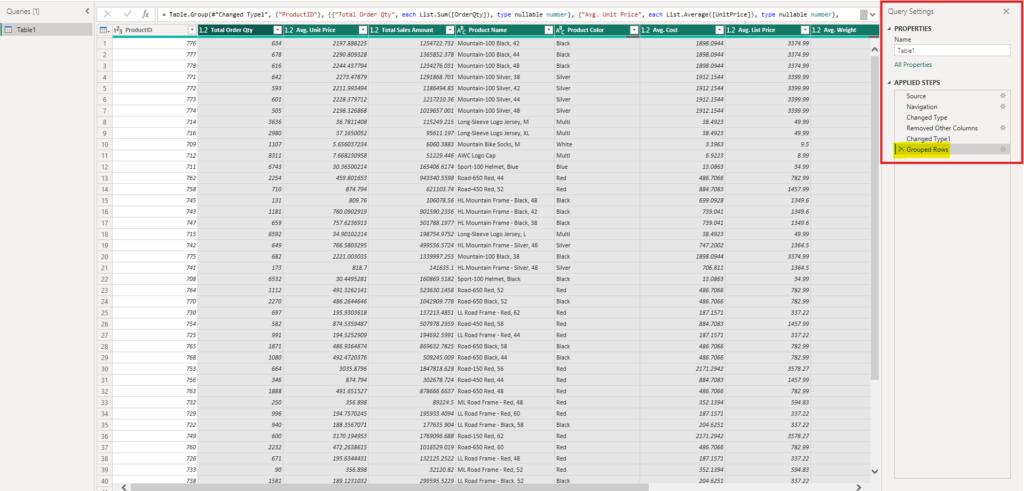
You are currently viewing How To Reduce Data Tables Using “Group By” in Power Query

How To Reduce Data Tables Using “Group By” in Power Query

The Group By function in Power Query, the data engine behind Power BI, is one of the most effective tools for reducing the size of your data model and improving report performance in Power BI or Excel. In this blog post, we walk you through exactly how to use it with an example. 

Introduction

When connecting to data sources in Power BI using Power Query or Excel, it is common to encounter large datasets with thousands, hundreds of thousands, or even millions of rows. While having granular data is often valuable for analysis, it can also slow down your reports and increase the size of your data model. 

A practical solution to this problem is to use the Group By function in Power Query. This function allows you to consolidate multiple rows into a single row based on a grouping variable, while applying aggregations (such as Sum, Average, Min, or Max) to your numeric and non-numeric columns. 

For example, let’s say you have daily sales data but you only need to analyze it at a monthly level. Rather than loading every daily transaction into your data model, you can group all the data into one row per month and dramatically reduce the number of rows your report needs to process. 

Want to follow along with our example? Download our free template!

To help you better understand how to use the Group By function in Power Query, we put together a Power BI template and sample Excel data.

Understanding the Data Before Grouping

Before applying the Group By function, it is important to understand the structure of your data. In our example, we have a sales query for a product manufacturer with the following columns:

.custom-table { width: 100%; border-collapse: collapse; background-color: #2b2b2b; color: #e0e0e0; font-family: sans-serif; font-size: 15px; } .custom-table th, .custom-table td { border: 1px solid #555; padding: 14px 16px; vertical-align: top; text-align: left; } .custom-table thead th { font-weight: bold; background-color: #2b2b2b; } .custom-table td:first-child { font-weight: bold; text-decoration: underline; white-space: nowrap; } .custom-table thead th:first-child { text-decoration: none; }
Column Name Data Type Description
SalesOrderIDWhole NumberThe unique identification number for the transaction.
OrderQtyWhole NumberThe quantity of items ordered.
ProductIDWhole NumberThe unique identification number for the product.
UnitPriceFixed decimal numberThe selling price per unit.
LineTotalFixed decimal numberThe total sales amount for the order line.
NameTextThe descriptive name of the product.
ColorTextThe color variant of the product.
StandardCostFixed decimal numberThe company's cost to make or buy the product.
ListPriceFixed decimal numberThe recommended retail price.
WeightDecimalThe physical weight of the product.
DaysToManufactureWhole NumberThe average number of days required to manufacture the product.
SellStartDateDateThe date the product first went on sale.
SellEndDateDateThe date the product stopped being sold.

Since we will be grouping by Product ID, every other column will need an aggregation applied to it. The aggregation you choose depends on the nature of the column and what your analysis needs. For example: 

  • Order Quantity – Sum, to get the total number of units sold per product. 
  • Unit Price – Average, to get the average selling price per product. 
  • Product Name – Min or Max, since the product name is always the same for a given product, either will return the same result.  

Apply this same logic to the remaining columns – numeric columns will typically use Sum, Count or Average, while descriptive columns (like Color or Product Name) can use Min or Max interchangeably.  

Note that any column you do not specify an aggregation for will be dropped from the resulting query. So, make sure to account for every column you wish to keep before applying the Group By. 

Now, let’s walk through how to use the Group By function in Power Query.

Step 1: Select Your Grouping Column & Open the Group By Dialog

In the Power Query Editor, click on the column you want to apply the Group By function to – in our case it’s the ProductID column. Then, navigate to the Transform tab and click the Group By button.

Power Query Editor interface with the ProductID column highlighted and the Group By feature selected in the Transform ribbon.

In the Group By dialog box, Power Query will automatically populate the column you chose as the “grouping column”. The Group By function offers two modes:

  • Basic: Group by a single column with a single aggregation.
  • Advanced: Group by one or more columns and apply multiple aggregations at once.

In our example, we will select the Advanced option. Even though we are only grouping by ProductID, the Advanced mode is necessary to add multiple aggregations.

The Group By dialog box in Power Query with Advanced settings toggled to group data by ProductID.

Step 2: Build Aggregations

Click Add aggregation to add a new aggregation for each column you want to keep. For each aggregation you will:

  • Give the new column a name (i.e., Total Order Quantity).
  • Select the operation (e.g., Sum, Average, Min, Max, Count Rows, or All Rows).
  • Choose the source column from the data (i.e., Order Quantity).

Repeat this process for every column you want to include in your grouped query. Using our example, the aggregations are:

  • Total Order Qty — Sum of Order Quantity
  • Unit Price — Average of Unit Price
  • Total Sales Amount — Sum of Line Total
  • Product Name — Min of Product Name
  • Product Color — Min of Color
  • Cost — Average of Standard Cost
  • List Price — Average of List Price
  • Weight — Average of Weight
  • Days to Manufacture — Average of Average Days to Manufacture
  • Sell Start Date — Min of Sell Start Date

Sell End Date — Max of Sell End Date

Advanced Group By window in Power Query showing multiple data aggregations being added for OrderQty, UnitPrice, and LineTotal.

Step 3: Review Results

After you click OK, you should see in the Applied Steps pane that a new step, Grouped Rows, has been applied. Now, the table should be formatted with each row representing a unique Product ID, with all the chosen aggregations as the columns.

Power Query data grid showing aggregated rows with the Grouped Rows step highlighted in the Applied Steps pane.

If you followed along with our example, the original sales query had 121,317 rows. After applying the Group By function, the query was reduced to just 266 rows, one for each unique product.

Power Query status bar showing a column profiling summary displaying 12 columns and 266 rows based on the top 1000 rows.

This is a massive reduction, and one that will have a significant positive impact on your data model size and report performance.

Wrapping it Up...

The Group By function in Power Query is a simple yet powerful feature that can dramatically reduce the number of rows in your data model, improve report performance, and make your data easier to analyze. Whether you are grouping daily data into monthly summaries or rolling up individual transactions into product-level totals, mastering this function is an essential skill for any Power BI or Excel user.

Need Help Implementing Power BI at Your Organization?

Our Microsoft Certified consultants can help