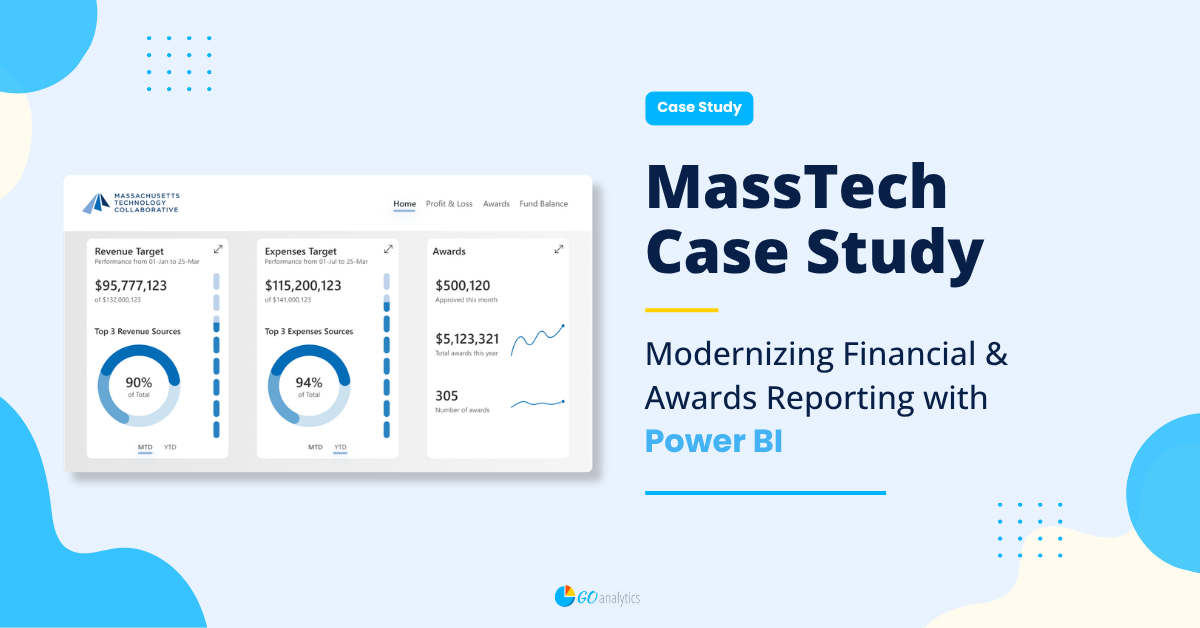
Go Analytics built a comprehensive Power BI dashboard that centralizes budgeting, awards, and fund balance data, enabling timely, division-level insights while preserving MassTech’s existing financial workflows.
- Power BI Consulting
- Data Visualization
Overview
The Massachusetts Technology Collaborative (MassTech) engaged Go Analytics to modernize its financial and operational reporting environment. The goal was to build a centralized Power BI dashboard that would bring together budget data, actuals, awards, and fund balances – all in a clean, interactive format aligned with MassTech’s fiscal processes and reporting priorities.
Go Analytics developed a dynamic Power BI solution that integrates directly with Budget Maestro’s SQL Server Analysis Services cube, connects to redesigned fund balance and awards datasets, and provides department-level users with easy access to daily refreshed insights. The end result is a visual, intuitive, and scalable reporting experience that enhances visibility across the organization.
About the Client
MassTech is a quasi-governmental organization that supports economic development across six strategic sectors, including cybersecurity, broadband, health technology, and advanced manufacturing. With funding flowing into multiple initiatives, MassTech monitors budgets, awards, and outcomes across several divisions to ensure responsible stewardship of public dollars.
The agency sought a reporting experience that would increase accessibility, strengthen visibility, and help staff review financial results more frequently – all without disrupting existing systems.
The Challenge
MassTech had a strong financial foundation in place, using:
- Budget Maestro for budgeting
- MIP for actuals
- SQL Server Analysis Services to house budget data
- Spreadsheet-based workflows for awards and fund balance reporting
These tools served the organization well, but MassTech saw an opportunity to:
- Enhance the timeliness of reporting: Teams were eager to review results more frequently than the traditional monthly and quarterly cycles.
- Provide departments with self-service insight: Divisions wanted quick access to spending, awards, and budget status without relying on manual report preparation.
- Improve clarity and interactivity: MassTech emphasized clarity, drill-down capability, and traditional profit and loss structures as core design needs.
- Support future growth in analytics: The organization anticipated needs such as grant pipeline reporting and contract/licensing management in later phases.
In short, MassTech wanted a modernized reporting layer that complemented their existing systems while creating a more accessible experience for staff.

Solution: A Strategic Power BI Implementation
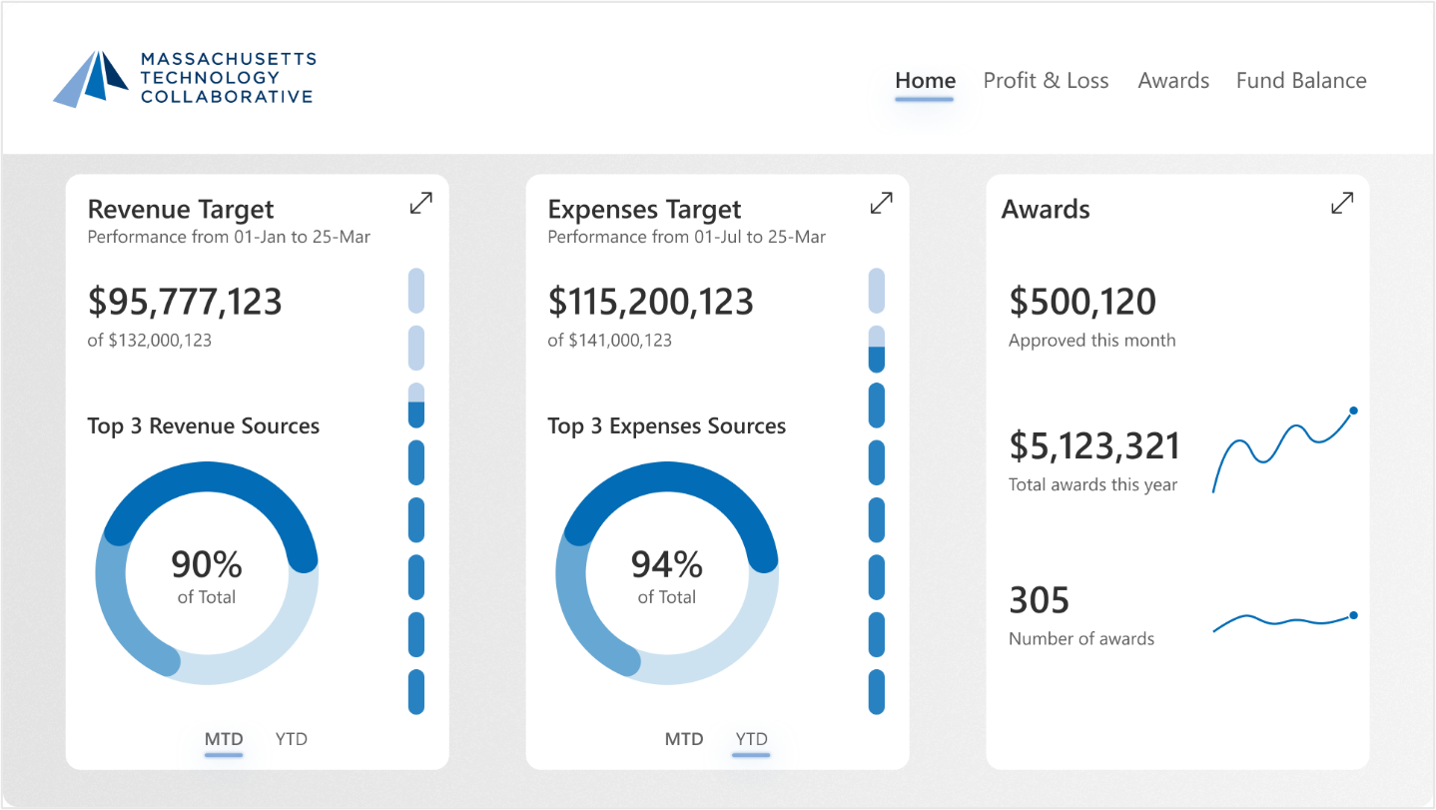
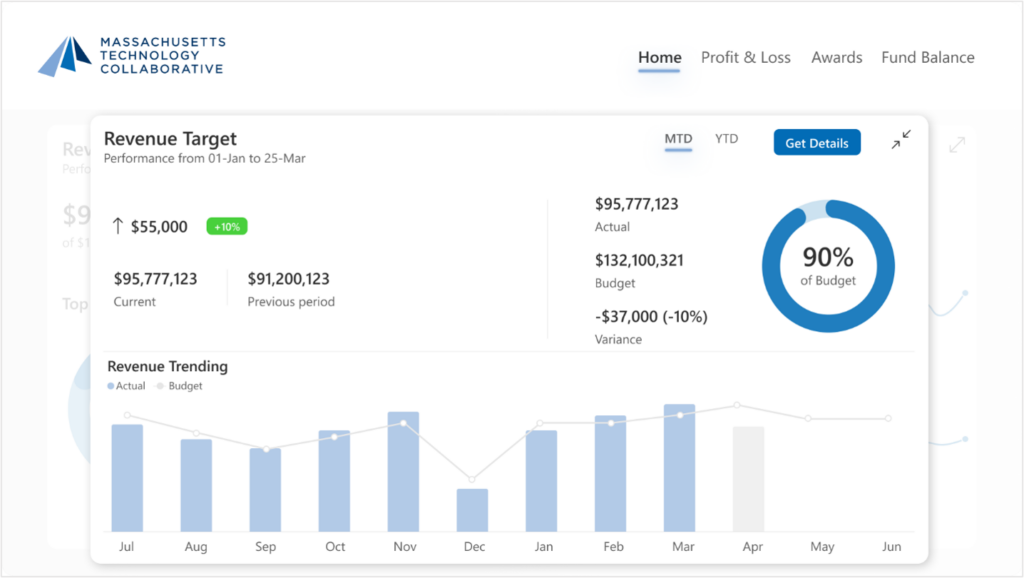
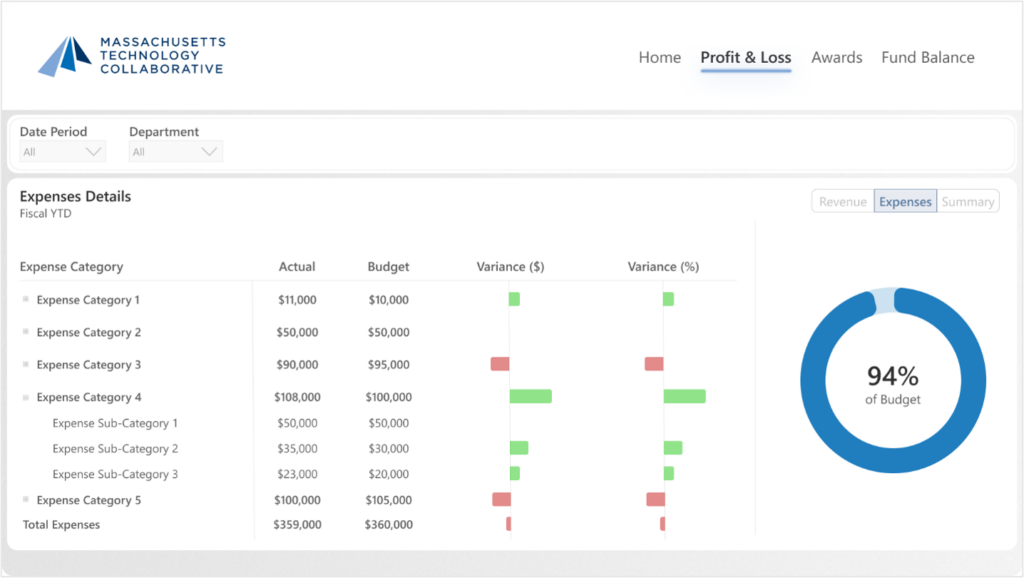
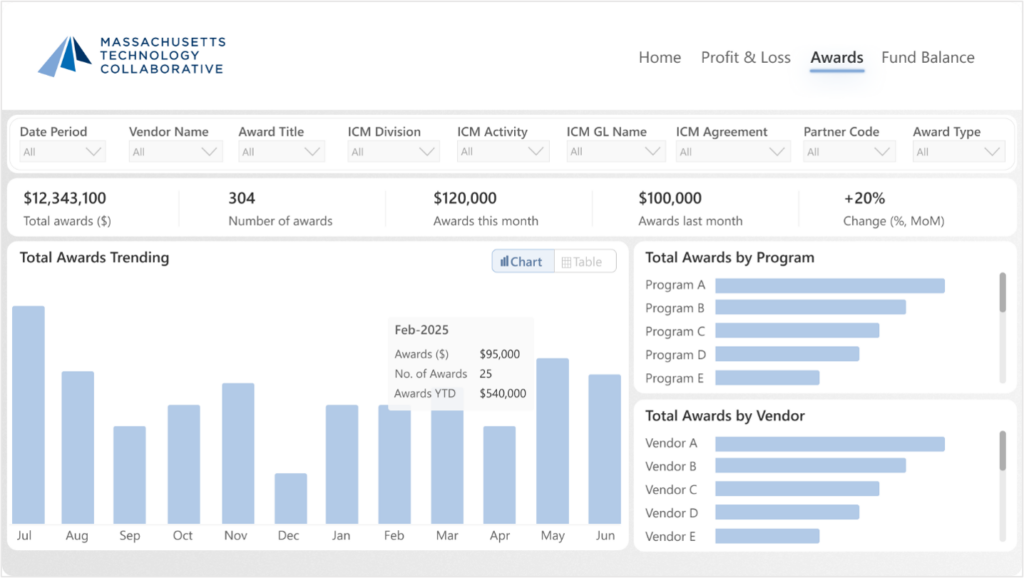
Go Analytics designed the MassTech FinHub Dashboard, a comprehensive Power BI environment that centralizes budgeting, awards, and fund balance data into a single, intuitive interface.
This approach enhances MassTech’s existing workflow while giving all seven divisions access to timely, easy-to-understand insights.
Direct Integration with Budget Maestro
To maintain continuity with MassTech’s financial processes, Go Analytics connected Power BI directly to the SQL Server Analysis Services cube provided through Budget Maestro.
This enables:
- Daily access to budget and actuals
- Consistent numbers across all reports
- A secure, role-based structure aligned with division needs
Redesigned Fund Balance & Awards Reporting
Go Analytics helped restructure fund balance and awards spreadsheets to make them Power BI–ready while preserving MassTech’s familiar categorization and workflows.
These enhanced datasets support:
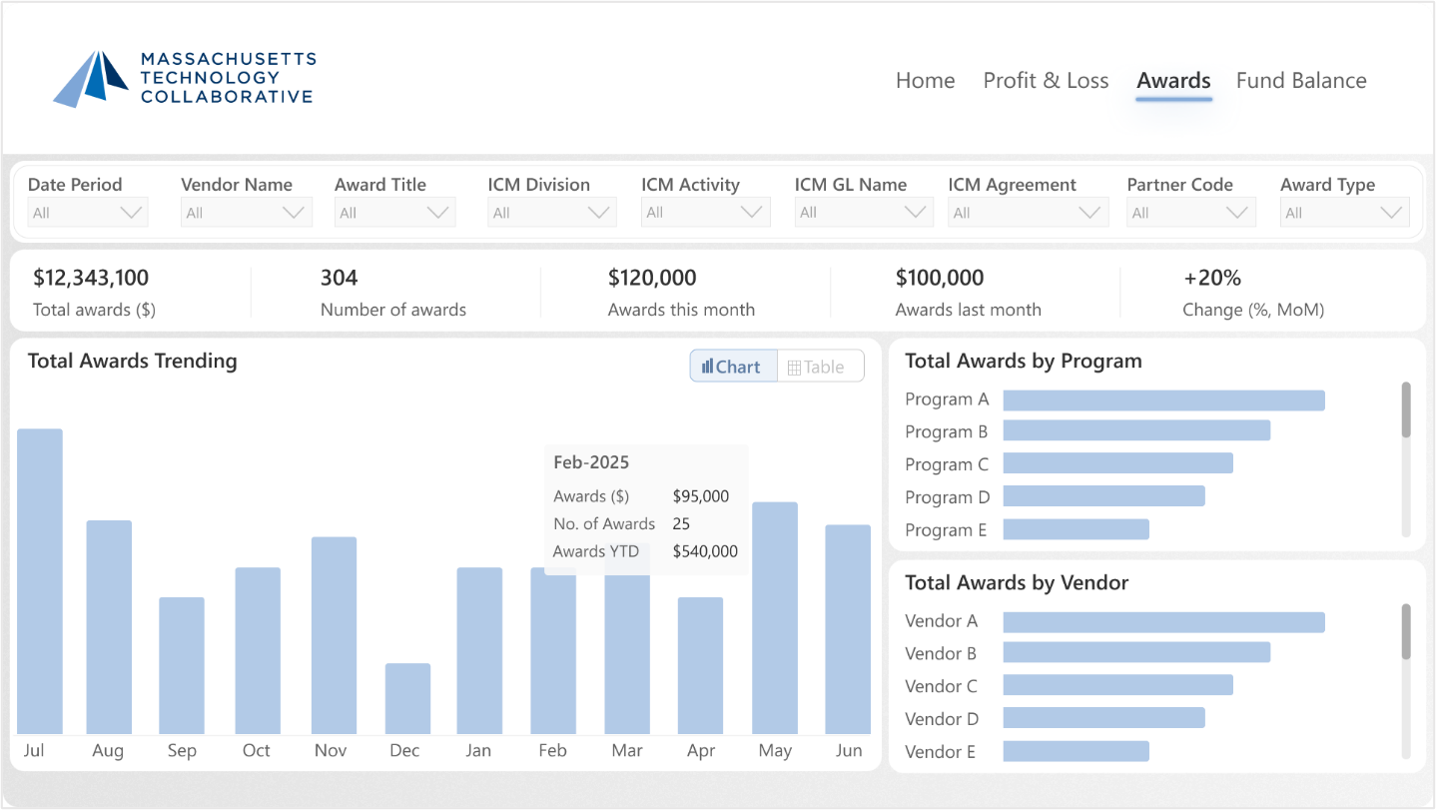
- Vendor-level and program-level drill-downs
- Committed vs. uncommitted fund visibility
- Month-over-month and year-to-date tracking
- Clear, structured layouts for simpler exploration
Custom Fiscal Year Date Table
MassTech operates on a July–June fiscal year, so Go Analytics built a fully dynamic date table tailored to this structure.
This enables:
- Accurate fiscal year-to-date and month-to-date toggles
- Period-over-period comparisons
- Correct alignment with internal financial conversations
Intuitive, User-Centered Dashboard Design
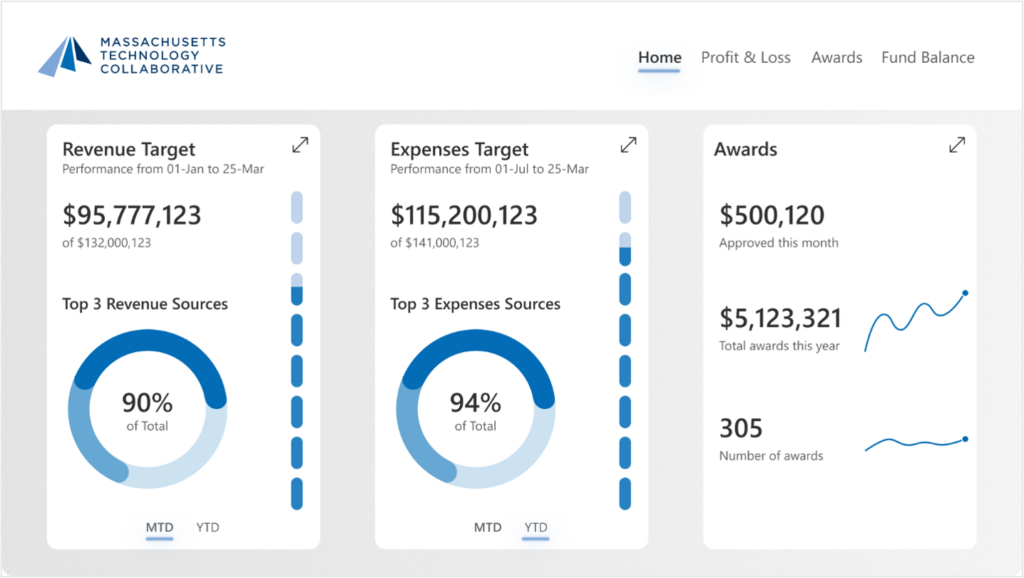
The FinHub Dashboard uses a consistent, easy-to-navigate layout with:
- Top-right page navigation
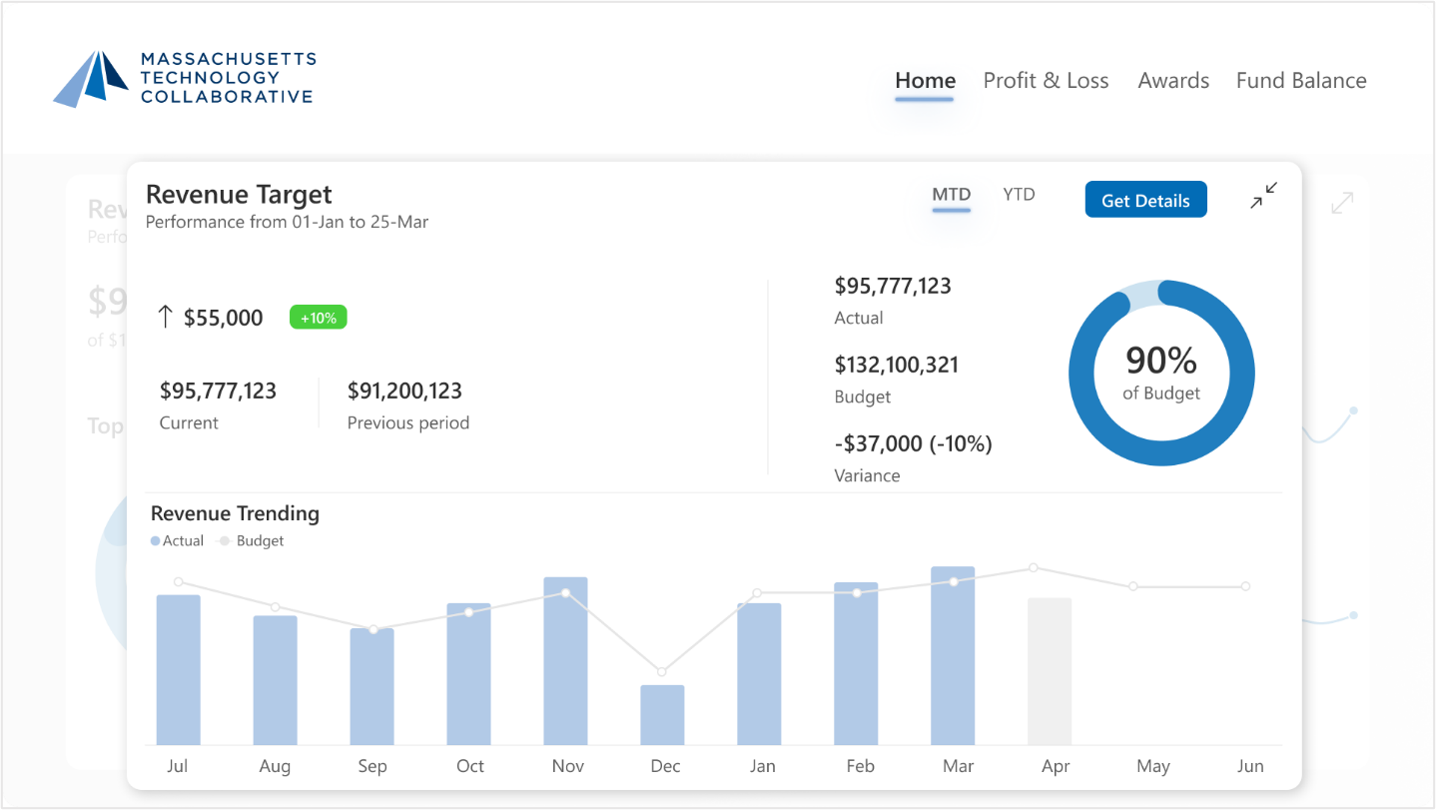
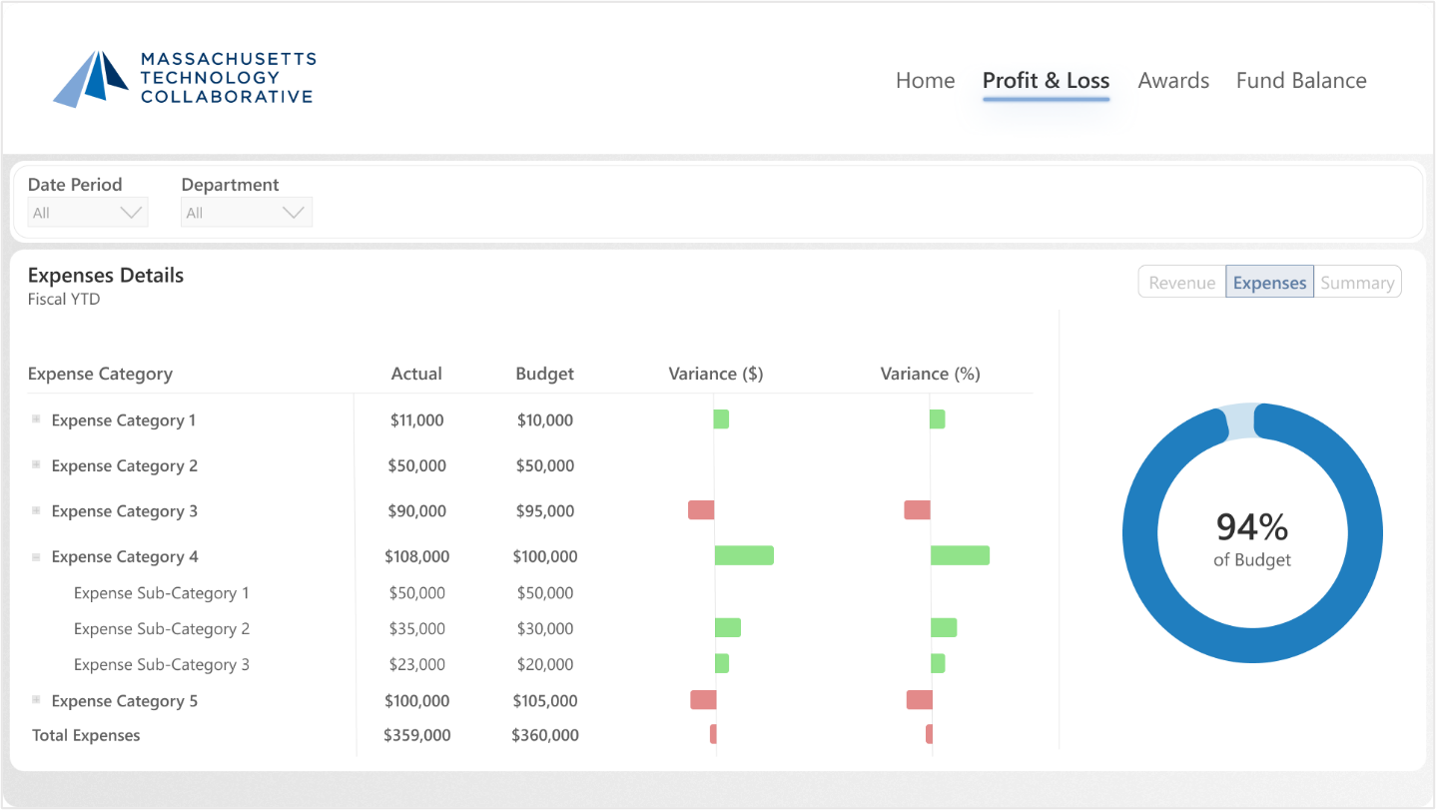
- Clear revenue and expense visuals
- Award summaries and program breakdowns
- Fund balance waterfalls and tables
- Pop-up pages for deeper detail
- Drill-down and cross-filtering throughout
The design reflects MassTech’s preference for clarity, simplicity, and clean P&L formatting.
Additionally, Go Analytics provided training to the teams involved to demonstrate how the dashboard can enhance their data-driven decision-making processes.
Daily Refreshes
Budget Maestro data now updates automatically every day, allowing teams to check their financial and awards activity more regularly than ever before. This shift helps divisions stay informed throughout the month, while still supporting traditional monthly and quarterly reporting cycles.
The Result
The Power BI implementation provides MassTech with a modern reporting experience that aligns with both everyday needs and long-term analytical goals.
More frequent, accessible insight for all seven divisions
Teams can now review spending, awards, and fund balance activity on demand; no manual preparation required.
Strengthened collaboration between finance and divisions
Departments access the information they need directly, allowing finance to focus on higher-value analysis.
A unified, visually intuitive reporting environment
The dashboard presents complex information in a clear, interactive format that supports faster understanding.
Flexible reporting that preserves familiar workflows
MassTech continues to rely on the systems they know, which are now enhanced with a modern analytics layer.
Excited and engaged end users
The organization embraced the dashboard quickly, expressing enthusiasm for the clarity and ease of use.
Conclusion
The MassTech FinHub Dashboard strengthens an already solid reporting ecosystem by bringing together budget, actuals, awards, and fund balances into a unified Power BI experience.
By enhancing accessibility, clarity, and timeliness – while maintaining the integrity of MassTech’s existing systems – Go Analytics delivered a modern analytics foundation that will support the agency for years to come.
MassTech now has:
- A scalable reporting platform
- An intuitive, visual environment for all divisions
- A BI foundation ready for future expansion
A true example of modernization through partnership.
Need Help Getting Started With Power BI?
Our Microsoft Certified consultants can help with the implementation of Power BI in your organization