How to Create a Dynamic X-Axis for the Last N Periods in Power BI
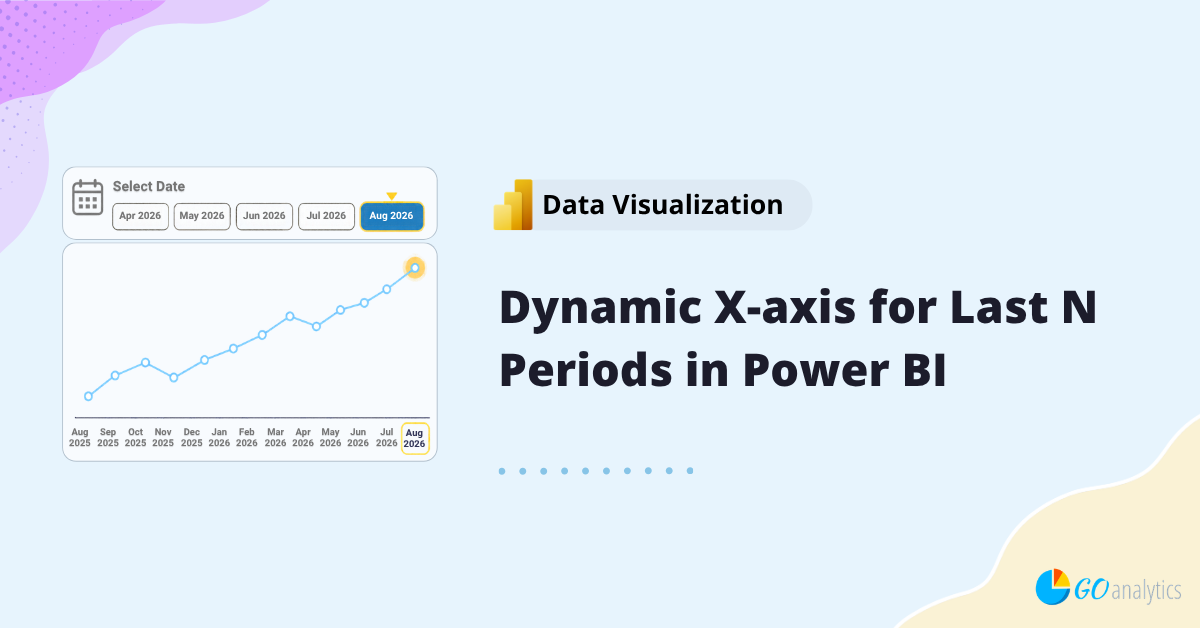
In this blog post, we walk you through how to create a dynamic X-axis for the last N date periods in a Power BI timeseries chart.
In this blog post we walk you through how to build a Power BI slicer that looks like something you'd find in a modern web application, using nothing but the native Button Slicer, some simple DAX, and a hosted image.
In this blog post we walk you through how to create a fully native GANTT chart in Power BI, using only a Matrix visual and some DAX.
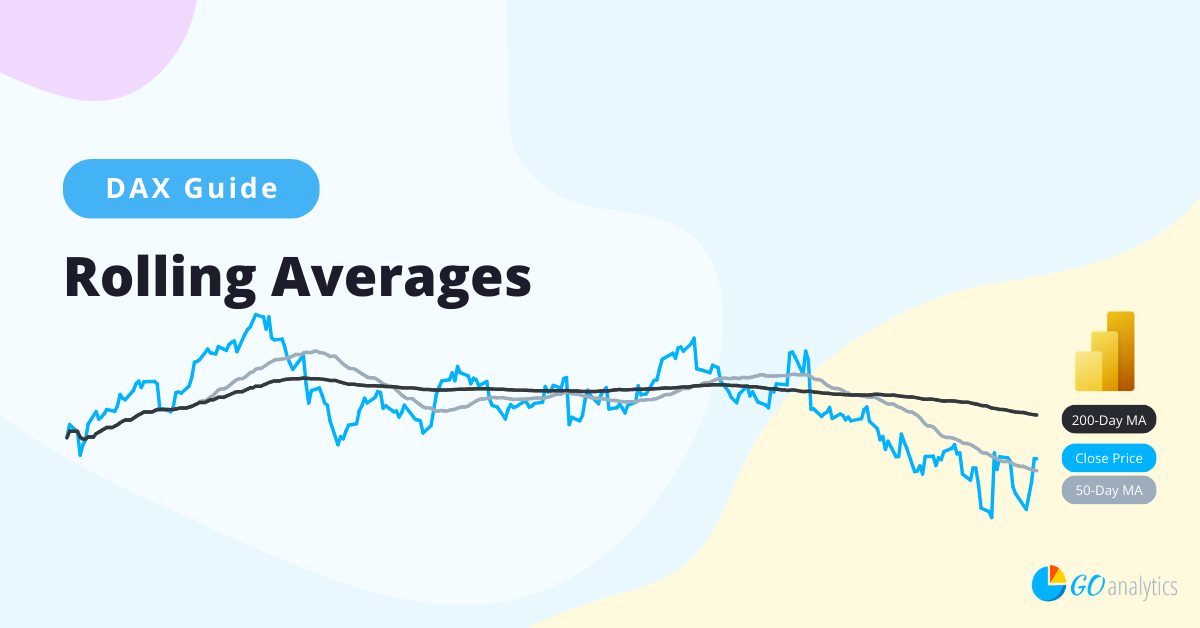
In this blog post, we provide a practical guide to creating rolling average (i.e., last 30 days) measures in Power BI using the built-in DAX (Data Analysis Expressions) programming language.
In this blog post, we show you how to create year-over-year calculations in Power BI using the built-in Data Analysis Expressions (DAX) programming language.