Power BI for Beginners: A Guide to Navigating Power BI Desktop
A beginner's guide to the Power BI Desktop interface, including its main views, reporting panes, Power Query, and newer features such as Copilot and Microsoft Fabric.
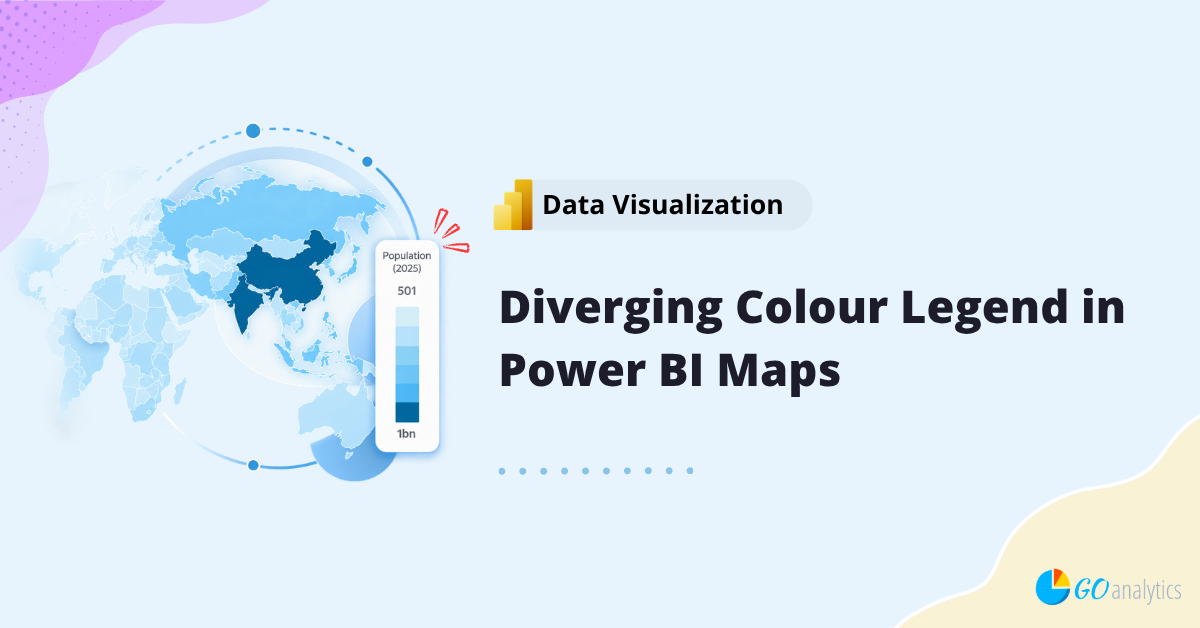
In this blog post, we walk you through how to build a custom legend for your shape maps in Power BI, using a world population example to show colours diverging from the lowest value to the highest.
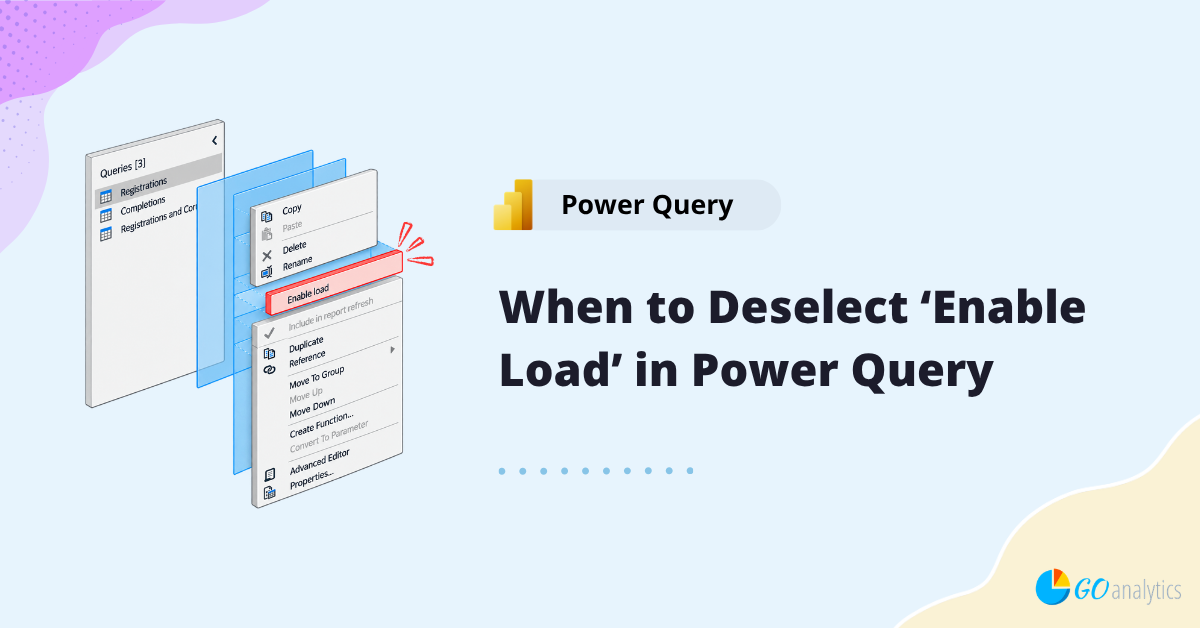
In this blog post, we walk you through when and why you should deselect Enable Load in Power Query. Follow along to see how you can keep your Power BI data model clean and optimize performance by loading only the tables you need.
In this blog post, we explore seven proven strategies to improve Power BI adoption in your organization.
In this blog post we walk you through how to build a waterfall chart in Power BI, using a real GDP by industry example to show incremental change from one period to the next.