

In this blog post, we answer the questions: what is Power BI and how can it be used to impact your business positively.
Power BI is a business intelligence (BI) platform developed by Microsoft. Originating from Power Pivot in Microsoft Excel, Power BI was created to allow users to connect to a wide range of data sources, including spreadsheets, databases, and web data sources, and then turn this data into actionable insights through the power of data visualization.
The Power BI tool offers users the ability to create interactive reports and dashboards that are connected to underlying data sources that can be automatically refreshed so you can be sure you are always analyzing the latest data.
While Power BI is designed to be intuitive to business users, it is important to understand the components of the tool.
Need Help Getting Started With Power BI?
Our Microsoft Certified consultants can help with the implementation of Power BI in your organization
Components of Microsoft Power BI
Power BI is made up of three main components. These are the Power BI Desktop, the Power BI Service, and the Power BI Mobile apps. A common workflow is that users use the Power BI Desktop application to connect to data and design interactive reports. They will then publish reports to the Power BI Service, which are available to be accessed through a web browser or via the Power BI Mobile application.
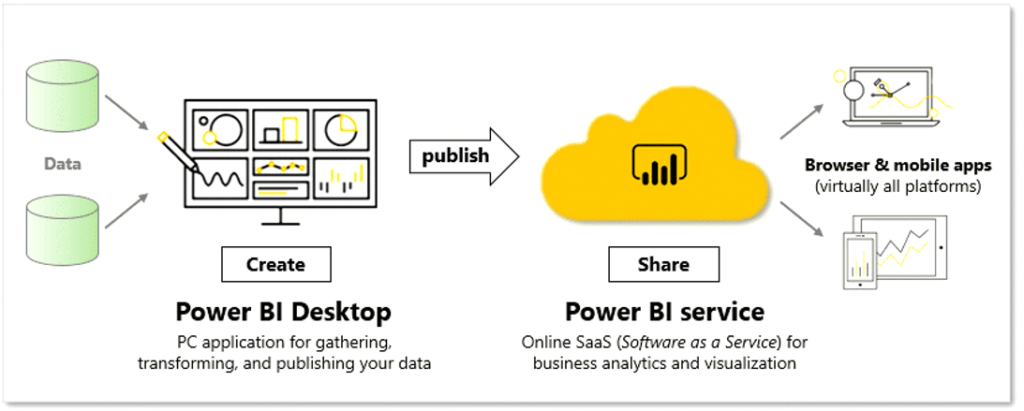
1. The Power BI Desktop Application
The Power BI Desktop application is a free software that can be downloaded to a local machine, which allows users to design and build interactive reports. This is where most data visualization projects start and it is where you can connect to data, make transformations to your data, and create visualizations.
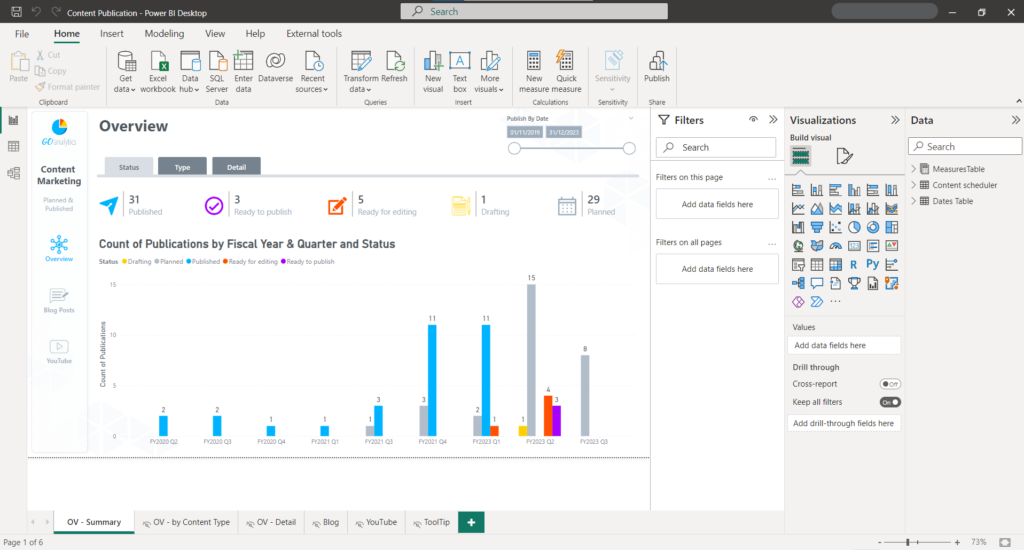
The Power BI Desktop application should feel very familiar to users comfortable with the suite of Microsoft Office products such as Excel, Word, or PowerPoint, as it offers the similar ribbon user experience to perform tasks.
In the Power BI Desktop application, Microsoft allows users to drag and drop visuals onto a canvas and then drag and drop data into those visuals to populate it with information. Visualizations are highly customizable in the Power BI Desktop application, like what you would experience in Excel.
Note: although many users would refer to the interactive reports built in Power BI Desktop as “dashboards”, Microsoft reserves that term for one-page views that can be created from reports in the Power BI Service.
2. The Power BI Service
The Power BI Service is a cloud-based platform that allows users to access and share their reports and dashboards from anywhere with an internet connection.
After completing a report in Power BI Desktop, you can “Publish” to share insights with your team. The Power BI Service is where your published Power BI report resides. From here, you can access all of your published reports and share them with the appropriate audience. This is also where you can schedule automatic refreshes to keep your datasets and reports up to date with the latest information.
While most data visualization projects start in the Power BI Desktop, you can also create reports that start in the Power BI Service by connecting to data and creating a report from scratch or by accessing pre-built applications that you can load your data into.
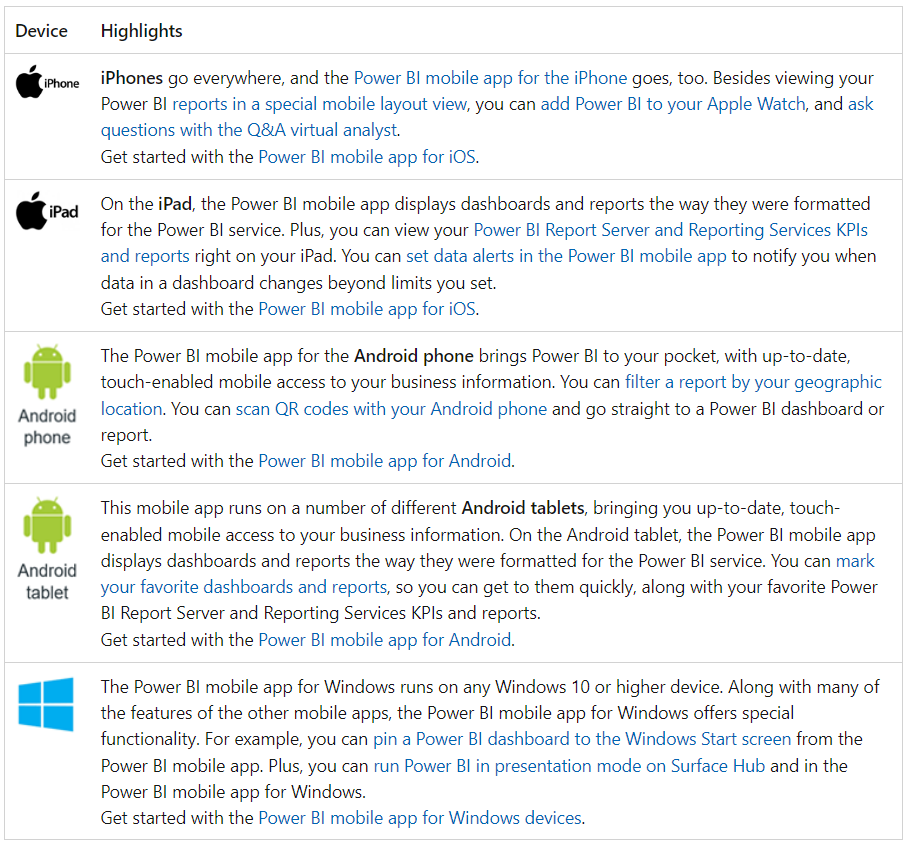
3. The Power BI Mobile Apps
The Power BI Mobile application allows users to access and interact with their reports and dashboards on the go. The mobile application is available for iOS, Android, and Windows devices. Below you can find a list of Power BI mobile applications for each device.
Key Features of Power BI
Power BI is a powerful data visualization that offers a wide range of features from the data gathering stage all the way through to the last little detail on your visuals. Below are the top 5 key features we believe makes Power BI great:
1. A Wide Range of Data Sources
With Power BI, users can connect to a wide variety of data sources, including flat files such as Excel, CSV, or PDF files, SQL databases, and cloud-based services like Salesforce and Google Analytics among many other.
As of the time of writing this blog post, the Power BI documentation listed over 170 data sources that users can connect to right out of the box without needing for custom connectors.
This feature makes it really easy for business users to bring in data from a variety of different sources and make sense of it, all inside of the Power BI.
2. Ease of Use
When deploying a new tool to your workforce, adoption is highly dependent on how quickly users can get up to speed on it.
Microsoft makes it seamless for users to get started using Power BI by allowing users to do most tasks in the Power BI Desktop application using buttons or dragging and dropping things onto a canvas. This allows users to start creating interactive data reports almost instantaneously, which will help with the adoption of the tool but also not prove to be a burden on productivity as users spend days learning a new piece of software.
A user starting with Power BI can connect to their data sources, make transformations to their data, create an interactive report, and share it across the organization without having to write a single line of code.
3. Strong Community of Power BI Users
When things start to get a little more complex (as they often do with data projects), Power BI offers a strong community that is ready and willing to help.
As a first-time user of Power BI, you might have lots of questions all of which have been answered in the Microsoft Power BI Community forum.
And then, sometimes you have a brand-new challenge that no one has tackled yet. Luckily, there is usually a member of the Power BI community ready to help explore the questions – sometimes within minutes.
4. Powerful Integrations With Microsoft Products
One of the top features of Power BI is its integrations within the Microsoft suite of products. In a previous blog post, we explored how you can embed live reports into PowerPoint, but the integrations go well beyond:
Excel – you can analyze data from a report that has been published in Power BI, making use of the data model and measures that were created in the report development stage. This means having the flexibility to create Pivot Tables and Pivot Charts from a clean dataset that was previously published.
SharePoint – you can integrate Power BI reports and dashboards in SharePoint websites so that you can bring insights right to where your users are most likely to see them.
Microsoft Teams – embed reports, dashboards, and apps into Microsoft Teams so you can have real-time conversations about the story your data is telling.
These among many other integrations (SharePoint Lists, Power Apps, Power Automate, etc.) are available with Power BI only – a bonus of being owned by Microsoft.
5. Competitive Pricing
The last (but not least) top feature of Power BI is its pricing. While competitors may charge upwards of $70 USD per user per month, Power BI offers options that make it affordable.
With the most affordable Power BI license priced at $9.99 USD per user per month, it enables even small businesses to start making the most out of their data to create a competitive edge in their industry.
For a full understanding of Power BI licensing, check out our blog post on Navigating Power BI Licensing and Costs.
How Can Power BI Benefit Your Organization?
In this blog post so far, we discussed what Power BI is, some key features and pricing. But how can this tool help your organization?
Power BI will help your organization build and cultivate a data-driven culture and it offers some key features to achieve on that goal.
First – Power BI can connect to a wide range of data sources. This allows businesses to access and analyze data from different departments and systems, giving them a more complete picture of their operations.
Second – Power BI allows businesses to create interactive charts, maps, and other visualizations that help them understand and analyze their data. These visualizations can be shared with others across the organization, making it easier to communicate insights and ideas.
Third – Power BI has a range of features that make it easy for teams to collaborate and share insights. Users can publish their reports and dashboards to the Power BI Service, where they can be accessed by others within the organization.
Fourth – Because Power BI is connecting directly to data sources, businesses can set up scheduled updates for reports and dashboards, ensuring that they always have the most up-to-date information. This helps them make more informed, timely decisions.
Need Help Getting Started With Power BI?
Our Microsoft Certified consultants can help with the implementation of Power BI in your organization
![Read more about the article Introduction to Power Query: What Is It? [2023]](https://goanalyticsbi.com/wp-content/uploads/2023/04/Intro-to-Power-Query-300x157.png)
![Read more about the article [How To] Import Data from Google Analytics into Power BI](https://goanalyticsbi.com/wp-content/uploads/2023/01/Blog-Feature-Image-Connect-to-Google-Analytics-300x157.png)