
In this blog post, we provide a step-by-step guide on setting up report pages in Power BI. Follow along to learn how to modify your report canvas size, colour, background, and more.
One of the first steps in creating a new Power BI report is to set up the report page – meaning that you must decide your report dimension, whether it will have a plain, coloured, or image background, and other settings.
Establishing a well-structured report page in Power BI is essential for improving the end-user experience and ensuring that key insights are easily accessible; it can also dramatically improve report performance. With a properly configured report, you can expect enhanced user engagement, improved Power BI adoption, and optimal impact of data-driven decision-making.
This guide provides a structured approach to setting up Power BI report pages efficiently and professionally.
Step 1: Creating a New Report Page
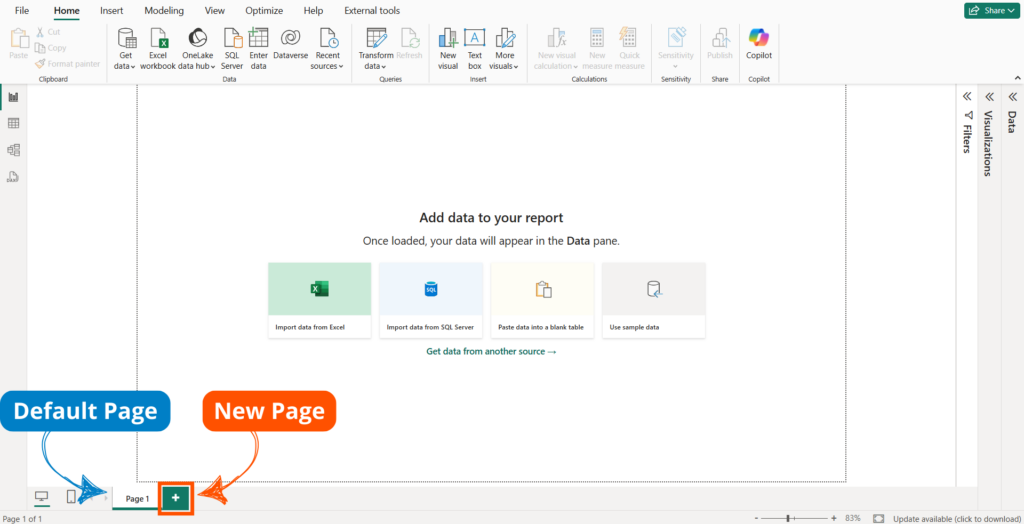
When we first open the Power BI Desktop, a blank canvas is presented. By default, it adopts a 16:9 ratio, suitable for most display screens. However, customization is available based on user requirements. This is our first report page, by default named Page 1, that we will configure with the required specifications of our project.
To create a new report page, we can click on the “+” button at the bottom of Power BI Desktop. But, more often than not, we simply duplicate an existing page that has already been customized to our required specifications to reduce duplication of work.
The following sections provide a step-by-step guide on editing key settings on your report page, including how to edit Page Information, Canvas Settings, Canvas Background, Wallpaper, Filter Pane, and Filter Cards.
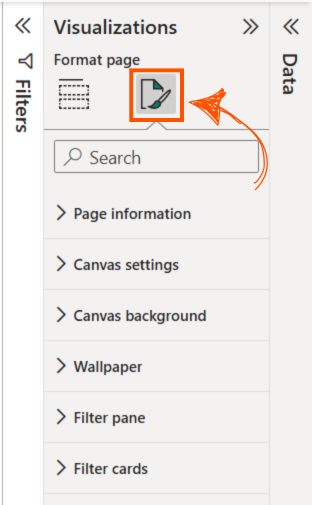
To customize your report page, you must not have any visualizations selected and then open the Format pane. It is important that no visualization has been selected, as this will open the formatting options for that specific visual in the Format pane.
Step 2: Page Information Customization
Under the Page Information section, we can edit the report page name and set up settings for tooltips and Q&A permissions.
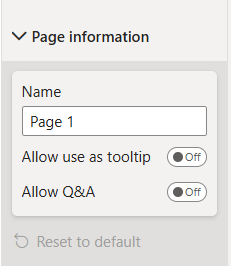
At this point, we can to assign a meaningful report page name. Alternatively, we can do this by double-clicking the page name at the bottom of Power BI Desktop and typing in the new page name or by right-clicking the page name at the bottom of Power BI Desktop, selecting Rename, and then typing in the new page name.
The other two settings under this section are the Tooltips and Q&A permissions:
- The Allow use as tooltip setting is turned off by default. Turning it on enables a report page to be used as a tooltip in other visuals, meaning users can hover over a data point in another report page and see additional contextual insights from this designated tooltip page.
- The Allow Q&A setting is turned off by default. Turning it on allows the report page to be included in Power BI’s natural language Q&A feature, meaning when users type a question in the Q&A visual, the page can be surfaced as a relevant response if the data aligns with the query.
Step 3: Canvas Settings Customization
Under the Canvas settings section, we can customize the size and layout of our report pages. Power BI provides multiple page size options tailored to different viewing formats:
- 16:9 (Default) – Optimized for standard dashboards viewed on monitors.
- 4:3 – Commonly used in legacy PowerPoint presentations and embedded reports.
- Letter (8.5×11) – Ideal for PDF exports and printed reports.
- Tooltip – Ideal for smaller, square custom tooltip page.
- Custom – Allows for precise dimensions suitable for specialized display requirements.
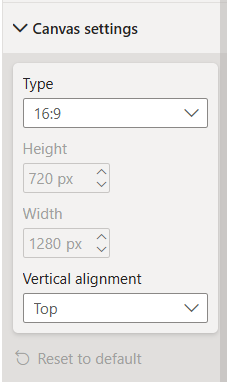
This section also allows Power BI report creators to adjust the vertical alignment of the report pages. The Vertical Alignment option determines how the report page is positioned within the Power BI viewing area when the canvas size is smaller than the display window. It allows users to align the report page to the Top or Middle, ensuring optimal placement and user experience, especially when working with custom page sizes or varying screen resolutions.
Step 4: Canvas Background Customization
Under the Canvas Background section, we can customize the background of our report pages. Power BI enables report creators to customize background of report pages with a solid colour or by uploading a background image.
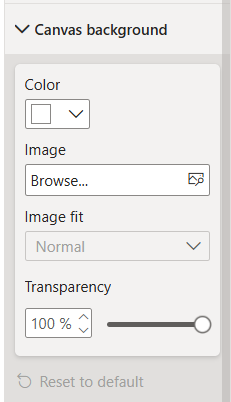
To change the report background colour, simply choose a colour from the colour picker and adjust the transparency which is set to 100% by default (i.e., fully transparent).
To upload a report background image, simply choose the Browse button and select your image. This is a great way to import a more customized report layout without cluttering your report pages with many shapes and images. For additional details on designing Power BI report layouts, check out our blog post 7 Power BI Hacks That Helped Us Wow Clients in 2024.
Note that for best results, your background image size should be consistent with your report canvas size. After our image is imported, all we have to do is adjust the Image fit for optimal scaling.
Step 5: Wallpaper Customization
In addition to the report canvas, Power BI allows customization of the wallpaper, which is the area surrounding the report page. This can be useful for branding or improving visual aesthetics.
Customizing the look and feel of the report wallpaper can be done under the Wallpaper section and it is similar to customizing the report page background.
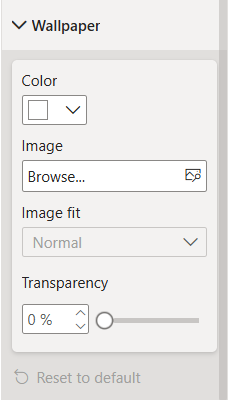
Applying a well-designed wallpaper ensures a cohesive and professional appearance, especially when embedding reports within an organization’s internal platforms.
Step 6: Filter Pane and Cards Customization
The filter pane in Power BI providers users with the ability to filter displayed data. The tool allows report creators to tailor the appearance of the fitler pane to enhance usability and brand alignment.
Under the Filter Pane section, we can adjust such things as the background colour, text colour and font types and sizes, transparency settings, and much more for the filter pane. Additionally, we can also customize the settings for the filter cards, which are the cards where users make selections for the filtering, by adjusting border styles, text colour and font types and sizes, background colour, and much more.
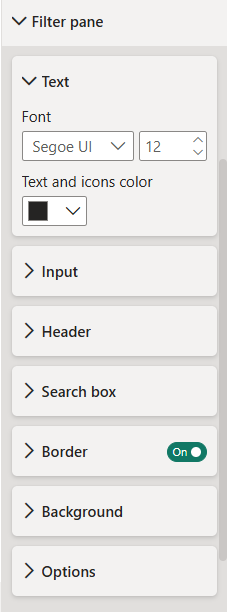
These enhancements contribute to a polished and user-friendly reporting experience, ensuring that users can interact with filters seamlessly while maintaining a consistent brand look.
Note that customization of the filter pane is optional and dependent on whether report creators choose to provide filtering through the filter pane or through on-page slicers. Not sure which one to use? Then you must read our Using Slicers vs. the Filter Pane in Power BI, where we discuss the benefits and drawbacks of each filtering method and provide some guidelines for when to use either method.
Wrapping It Up
Power BI puts full customization of report pages and the filter pane at the fingertips of report creators, allowing for the design and development of impactful reports that are consisten with branding guidelines.
By customizing report page sizes and backgrounds, colours and fonts, Power BI report creators can deliver an advanced user experience that will get buy-in from the organization, improve Power BI adoption, and lead to better data-driven decision-making.
Need Help Getting Started With Power BI?
Our Microsoft Certified consultants can help with the implementation of Power BI in your organization
![Read more about the article [How To] Connect to Web Data Sources in Power BI](https://goanalyticsbi.com/wp-content/uploads/2023/01/Connect-to-web-data-sources-in-Power-BI-300x157.png)