
In this blog post, we walk you through why your URL links in Power BI may not be clickable and...
Read More
Troubleshooting: Can’t Click Links in Power BI
In this blog post, we walk you through why your URL links in Power BI may not be clickable and...
Read More
How To Reduce Data Tables Using “Group By” in Power Query
In this blog post, we provide a step-by-step guide on how to use the Group By function in Power Query...
Read More
How to Connect to Multiple Tables in a Folder in Power BI Desktop
In this blog post, we provide a step-by-step guide on how you can connect to a local folder in the...
Read More
Centralized vs. Distributed Power BI: And Why Most Organizations End Up Hybrid
In this post we break down the ins and outs of a centralized versus a distributed Power BI implementation strategies...
Read More
A DAX Guide to Rolling Average Measures in Power BI
In this blog post, we provide a practical guide to creating rolling average (i.e., last 30 days) measures in Power...
Read More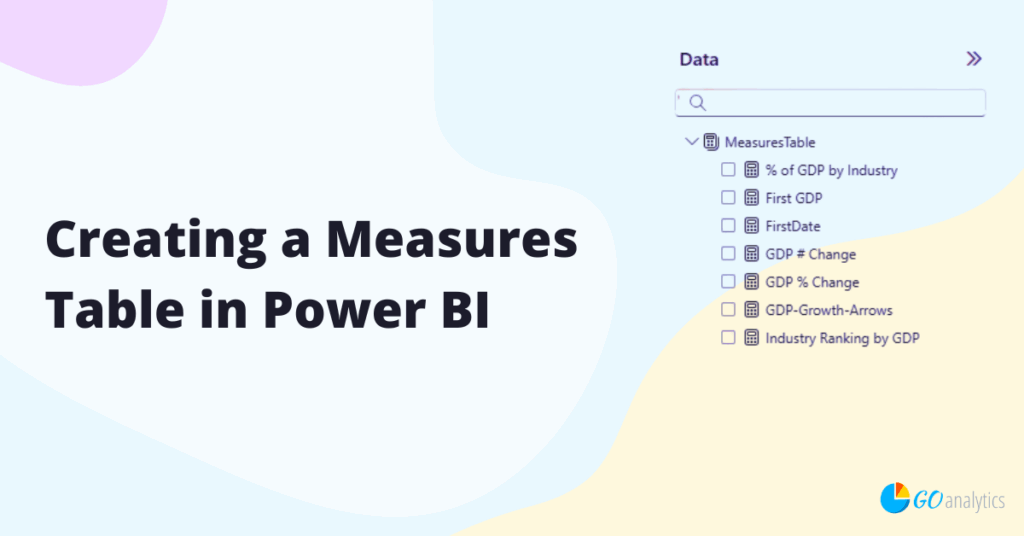
Creating a Measures Table in Power BI (And Why You Should)
In this post, we show you how to create a dedicated Measures Table to keep your calculations organized, your data...
Read More
Duplicate vs Reference in Power Query: What’s the Difference?
In this blog post, we explain the difference between Duplicate and Reference in Power Query - both in Power BI...
Read More
How to Create Year-Over-Year Calculations in Power BI (DAX Guide)
In this blog post, we show you how to create year-over-year calculations in Power BI using the built-in Data Analysis...
Read More
Replace Multiple Column Values in One Step in Power Query
In this blog post, we provide a detailed tutorial to dynamically replace multiple column values in one step in Power...
Read More