Construction Labour Market Dashboard
Sample Dashboard Built for the Construction Industry
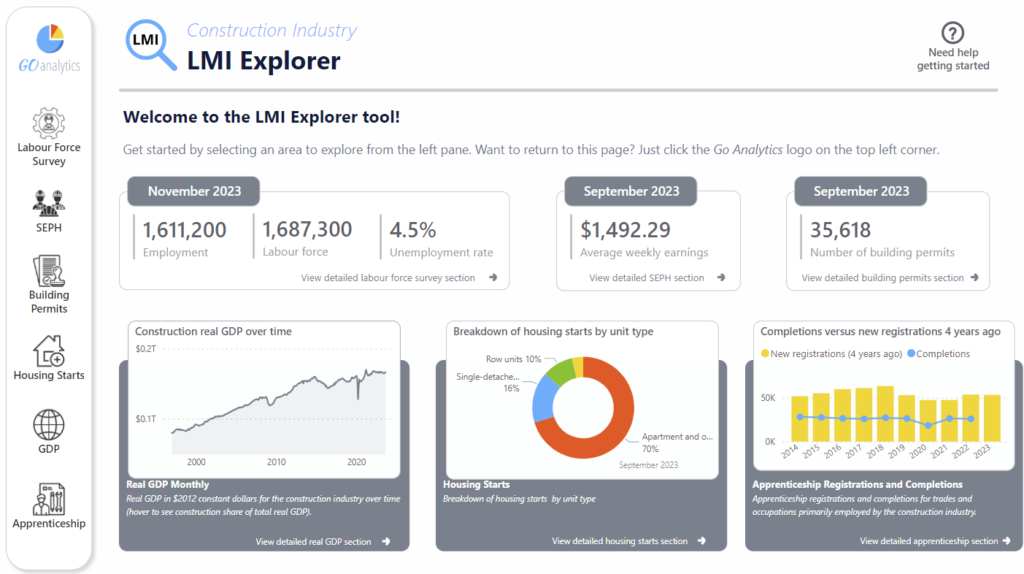
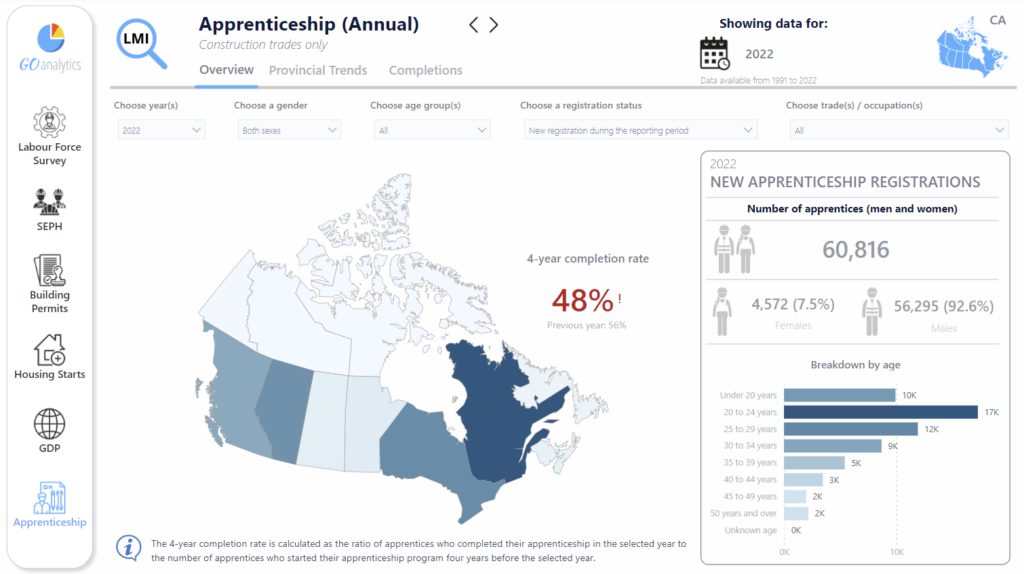
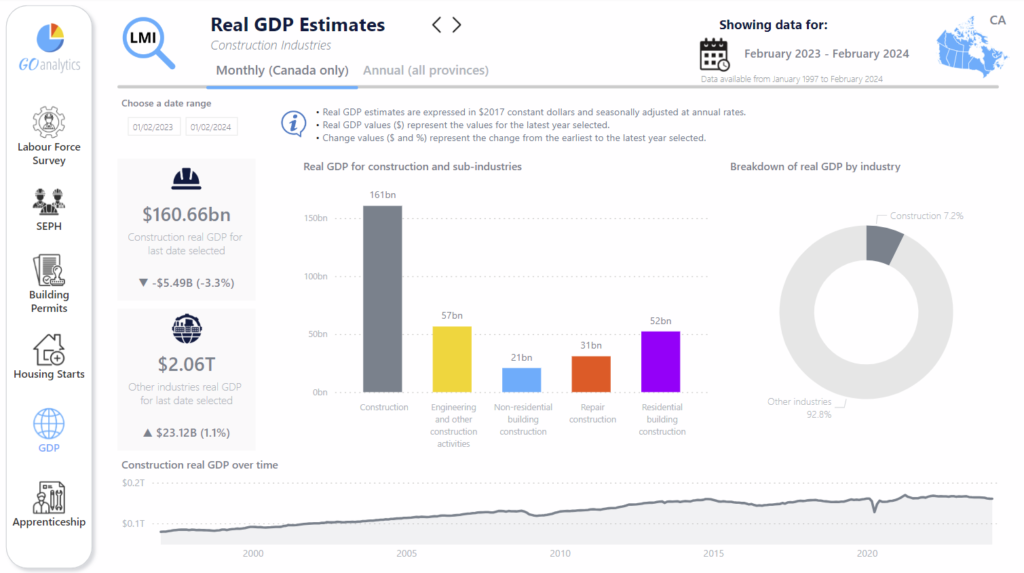
The Power BI dashboard below was prepared for one of our clients involved in the analysis of construction labour markets across Canada. Working closely with the client, we built a tool that brings together multiple data sources from Statistics Canada to provide an overview of the construction labour markets. Key datasets include:
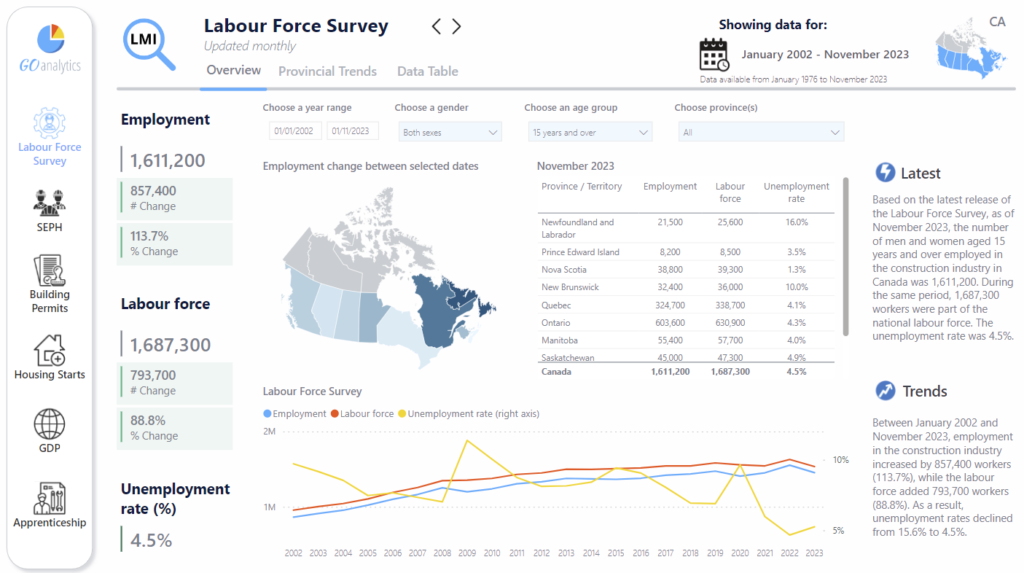
- Labour Force Survey (Monthly)
- Survey of Employment and Payroll Hours (Monthly)
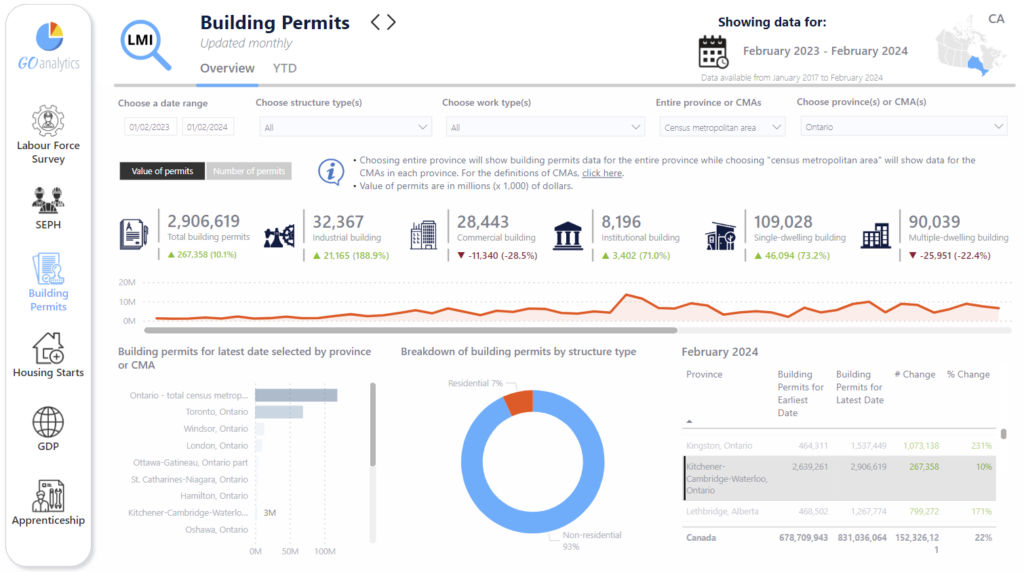
- Building Permits (Monthly)
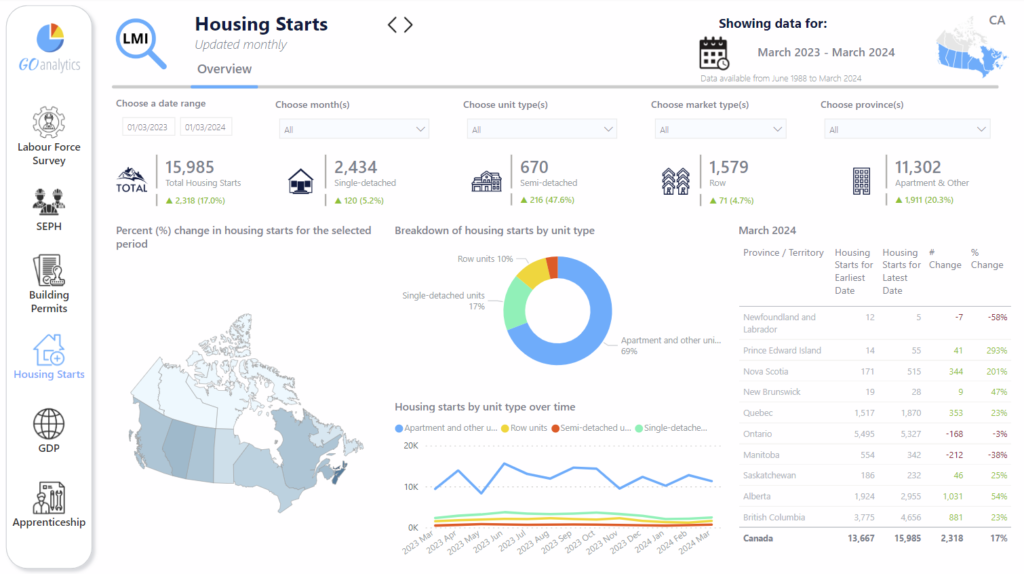
- Housing Starts (Monthly)
- Gross Domestic Product (Monthly)
- Apprenticeship Registrations and Completions (Annual)
Some of the key features of this dashboard include:
- Ability to dive deeper into provincial and census metropolitan details
- Ability to filter employment data for gender, age groups, and date ranges
- Interactive view allows for deeper insights
- Data gathering and transformation is automated, so the dashboard is always up to date with the latest data from Statistics Canada
×
The following are screenshots of the LMI Explorer tool. To view the interactive dashboard, access this page via a computer or tablet.
