Canada's GDP Dashboard
Sample Dashboard to Showcase Monthly Insights Into Economic Performance
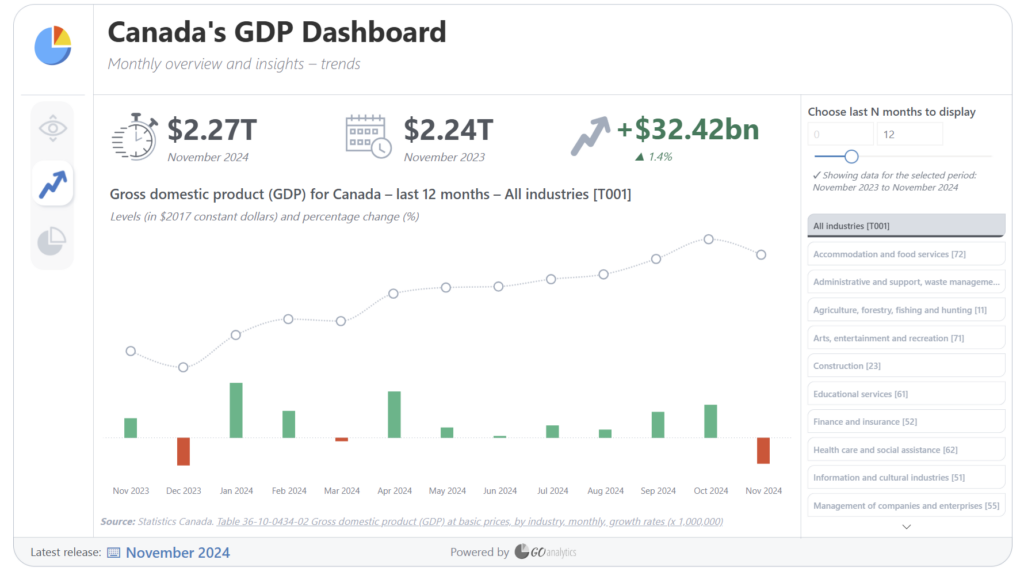
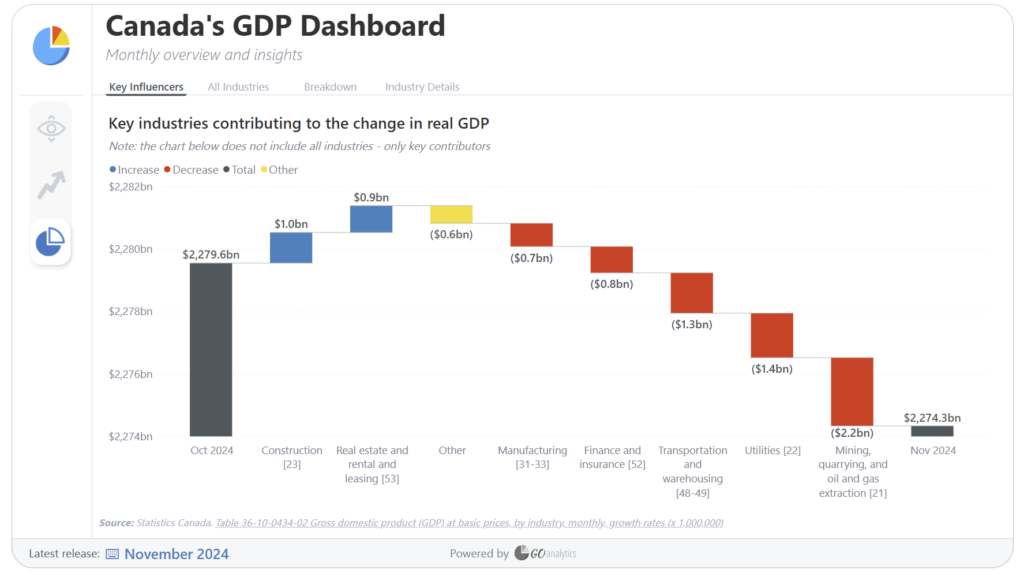
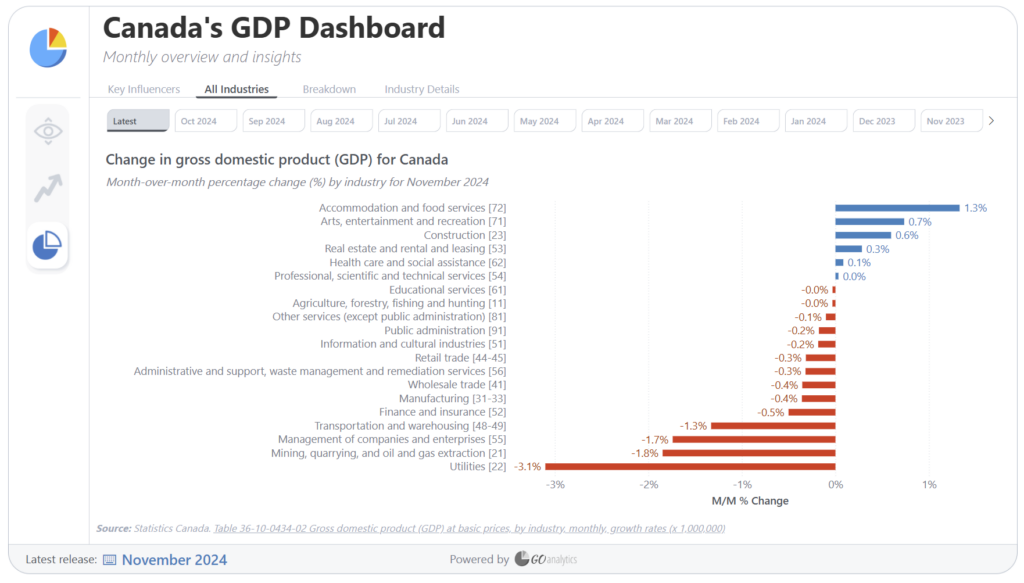
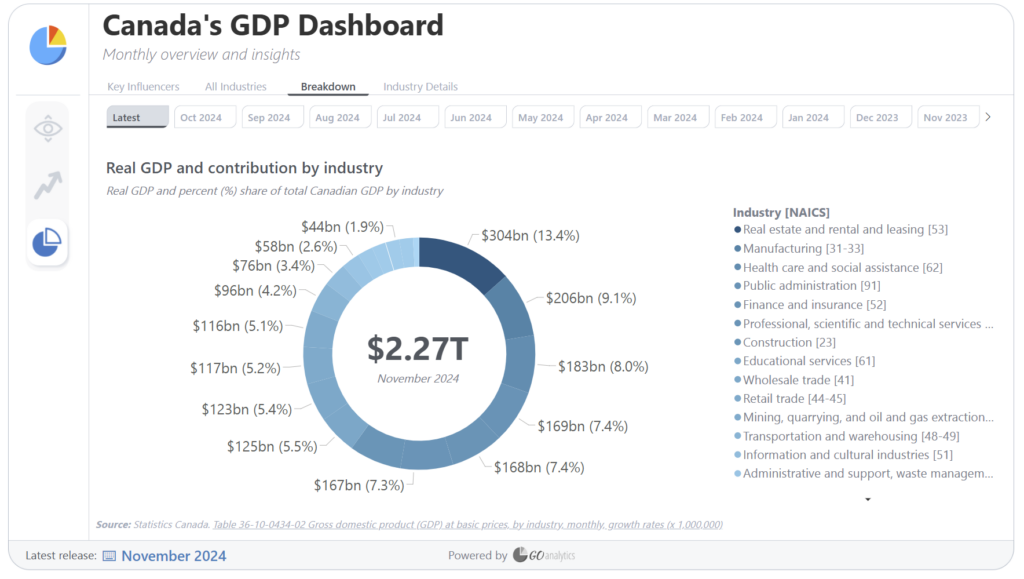
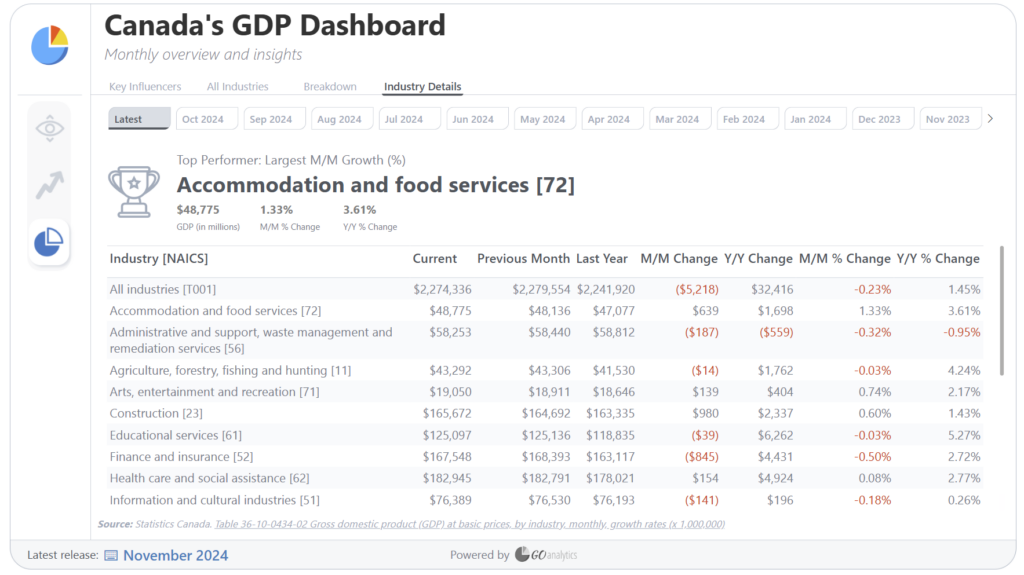
This interactive Power BI dashboard provides a comprehensive view of Canada’s GDP trends, offering insights into overall economic performance and industry-level contributions. Built using Statistics Canada data, it allows users to analyze GDP fluctuations over time, identify key drivers of growth or decline, and break down economic performance by sector.
Key features include:
✅ Dynamic trend analysis – Track monthly GDP levels and percentage changes.
✅ Industry breakdowns – See which sectors are driving growth or experiencing declines.
✅ Key influencers visualization – Identify top contributors to GDP changes at a glance.
✅ Custom time filters – Adjust the period to focus on recent trends or historical comparisons.
Designed for business leaders, policymakers, and analysts, this dashboard transforms raw economic data into actionable insights.
Tools used: Python, Statistics Canada API, Power BI, DAX, Statistics Canada data
Want a similar dashboard for your industry? Let’s talk.
The following are screenshots of the Canada’s GDP Dashboard. To view the interactive dashboard, access this page via a computer or tablet.
