
![You are currently viewing Introduction to Power Query: What Is It? [2023]](https://goanalyticsbi.com/wp-content/uploads/2023/04/Intro-to-Power-Query.png)
In this blog post, we provide an introduction to Power Query – Microsoft’s data transformation and data preparation engine that lives inside of Microsoft Excel and Microsoft Power BI.
Note
screenshots of Power Query in this blog are from inside Power BI, but the user interface in Excel is similar.
What Is Power Query?
Power Query is a data transformation and cleansing tool that is a part of Microsoft Power BI and Excel. It allows users to import data from various sources, transform and manipulate it, and load it into a destination data model or a report.
Power Query provides a user-friendly interface for performing complex data transformations and cleansing operations without writing complex code. It supports a wide range of data sources such as databases, files, web pages, and other data sources.
Some of the features of Power Query include data filtering, grouping, merging, appending, pivoting, and unpivoting. It also includes functions for handling text, dates, and numerical data.
Power Query is widely used in data analytics and business intelligence to help users clean and prepare data for analysis and reporting.
Need Help Getting Started With Power BI?
Our Microsoft Certified consultants can help with the implementation of Power BI in your organization
Who Uses Power Query?
Power Query is used by a variety of professionals, including data analysts, business analysts, financial analysts, accountants, and anyone else who works with data.
Power Query is particularly popular among professionals who work with large and complex datasets that require significant manipulation and transformation before they can be analyzed or reported on. It is used in a wide range of industries, including finance, healthcare, marketing, and government.
Power Query is also popular among users of Microsoft Excel and Power BI, as it provides an easy-to-use interface for performing data transformations and cleansing operations without the need for complex coding or scripting.
Overall, anyone who needs to import, transform, and cleanse data from multiple sources can benefit from using Power Query to streamline their workflow and make their data analysis more efficient and accurate.
What Can You Do With Power Query?
Power Query is a powerful tool for automating data importing and data transformation processes, allowing data professionals to save time by eliminating manual data-cleaning processes from their day-to-day.
With Power Query, you can perform a variety of data transformation and cleansing tasks to prepare data for analysis and reporting. Some of the things you can do with Power Query include:
Import data from various sources
Power Query can import data from a wide range of sources, including databases, spreadsheets, files, and web pages. According to Microsoft’s documentation on data sources in Power BI Desktop, there are over 140 different data sources that you can connect to in Power Query.
Some of the main data sources you can connect to include: Excel spreadsheets, CSV files, SQL Server and other SQL databases, Azure, SharePoint, Salesforce, Dynamics 365, and web.
Clean and transform data
Using Power Query’s intuitive interface or by the means of programming (using the native M language), you can cleanse and reshape your data in Power Query.
You can use Power Query to remove duplicates, filter data, split columns, merge tables, and transform data in other ways.
Handle errors and exceptions
Power Query can handle errors and exceptions that may arise during data transformation, such as missing data or invalid values.
Create custom calculations
Power Query allows you to create custom calculations and formulas to manipulate and transform data in ways that are not possible using standard Excel functions. This can be complex formulations to filter your data, transform your data, or create new calculated columns.
Automate data refreshes
Power Query can automatically refresh data from the source when it changes, so your reports and analyses are always up-to-date. Your new data will pass through all the data transformations you have built in so that you don’t need to re-do all that work.
Combine data from multiple sources
Power Query can combine data from multiple sources into a single data model, making it easy to perform analysis and reporting on a consolidated dataset. Power Query allows you to merge datasets together or append similar queries with each other.
How Do You Use Power Query?
Getting started with Power Query is quick and easy.
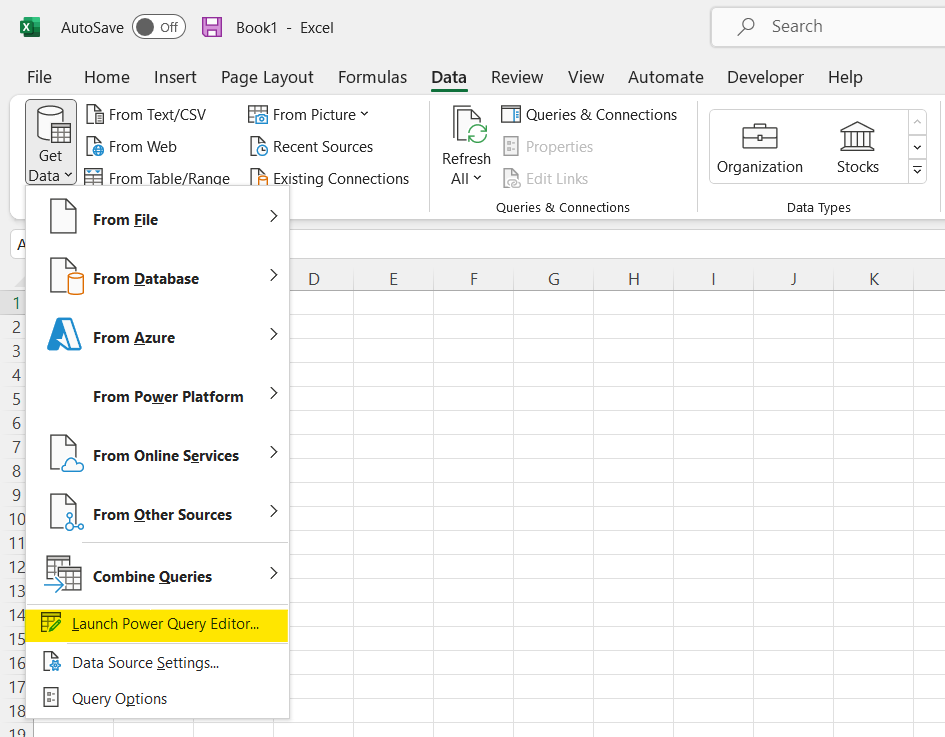
To launch the Power Query Editor from Microsoft Excel, simply navigate to the Data tab on the ribbon, expand the Get Data menu, and then select Launch Power Query Editor….
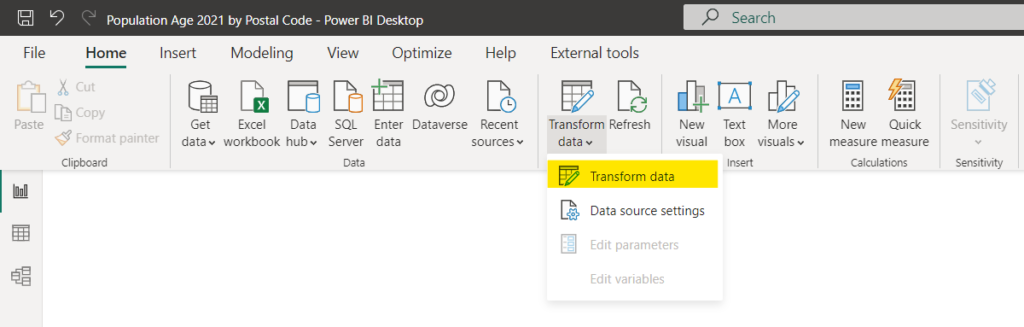
To launch Power Query from Power BI, simply expand the Transform data menu from the Home tab on the ribbon and select Transform data.
The Power Query window is divided into four (4) parts: the ribbon, the queries pane, the data-preview pane, and the query settings pane.
The Ribbon
Power Query, like many Microsoft products, provides a ribbon that allows users to perform tasks by clicking buttons.

The Home tab on the ribbon allows users to connect to data sources and quickly perform common data transformations such as removing columns and rows, changing data types, or merging and appending queries.

The Transform tab on the ribbon offers a wide range of data transformations and data reshaping. Users can reduce the number of rows in their queries by grouping data; replacing column values; transposing, pivoting, and unpivoting data; splitting column values, and running R or Python scripts to transform their data.
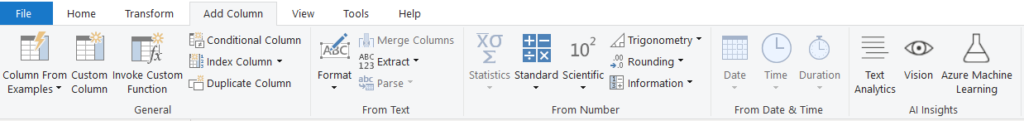
The Add Column tab on the ribbon allows users to enhance their datasets by adding calculated columns using different techniques, such as extracting parts of a date column (i.e. get month name from a date value), formulating a conditional column, or generating a custom calculation using some M programming.
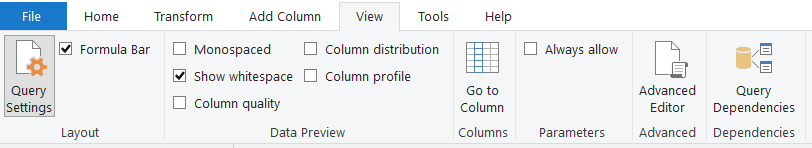
The View tab on the ribbon allows users to toggle on and off certain views. Toggling Column distribution, Column profile, or Column quality from the Data Preview section users can learn more information about their data such as the number of blank values within a column, or statistics such as the average, minimum, and maximum values of a column.
From the View tab (as well as the Home tab), users can open the Advanced Editor – a window that allows users to see and edit the code behind all their data transformations.
The Tools tab on the ribbon allows users to perform diagnostics on their queries. In contrast, the Help tab offers links to different help pages from Microsoft such as documentation and community pages.
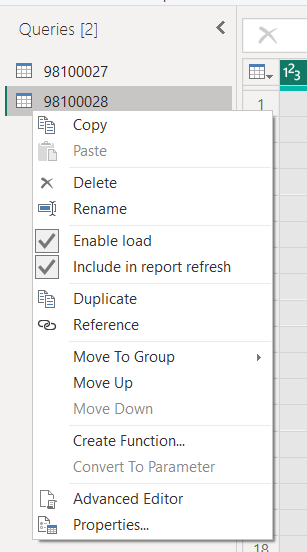
The Queries Pane
The Queries pane, on the left-hand side of your Power Query window, shows all the queries (datasets) that have been imported into Power Query. From this pane, you can move across all your datasets to make data transformations or mitigate errors within your data load.
From the Queries pane, users can also perform tasks on their queries such as renaming, deleting, or duplicating their queries.
The Data Preview Pane
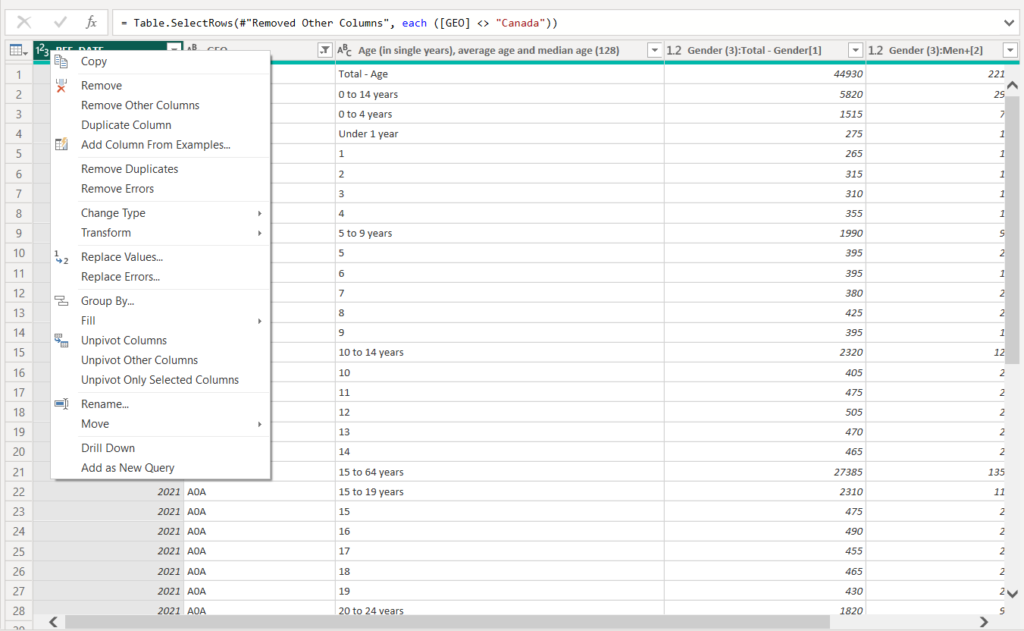
The Data Preview pane, centered on the Power Query window, provides a preview of the data in each query and allows users to make transformations to each column right on the screen. The Data Preview pane shows users column names and data types and allows users to modify these right from the table headers.
The Query Settings Pane
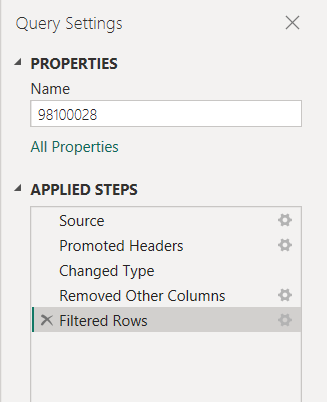
The Query Settings pane, located on the right-hand side of the Power Query window, shows the properties and applied steps to the query that is currently selected. Users can use this pane to rename and modify properties on their queries, or to manage steps applied to their queries (i.e., see applied steps, edit transformations, or delete steps).
![Read more about the article [How To] Import data from PDF into Power BI](https://goanalyticsbi.com/wp-content/uploads/2022/12/Import-From-PDF-300x157.png)
![Read more about the article [How To] Enter data directly into Power BI Desktop](https://goanalyticsbi.com/wp-content/uploads/2022/12/Entering-Data-in-Power-BI-300x157.png)