
![You are currently viewing [How To] Import data from PDF into Power BI](https://goanalyticsbi.com/wp-content/uploads/2022/12/Import-From-PDF.png)
One of the many useful features of Microsoft Power BI is the ability to connect to data from various sources, including PDF reports. This can be a great way to import data quickly and easily from PDF reports into Power BI, allowing you to create dynamic and interactive visualizations and reports.
Although most of the time when working with data in Power BI you will be connecting to a data table such as Excel, CSV, SQL Server, or other database, sometimes all you have is a PDF report. When the data in this report is very valuable but you need to add it to your interactive reports, that’s where the PDF connector in Power BI comes in handy.
Let’s look at how we extract data from a PDF report in the Power BI Desktop application.
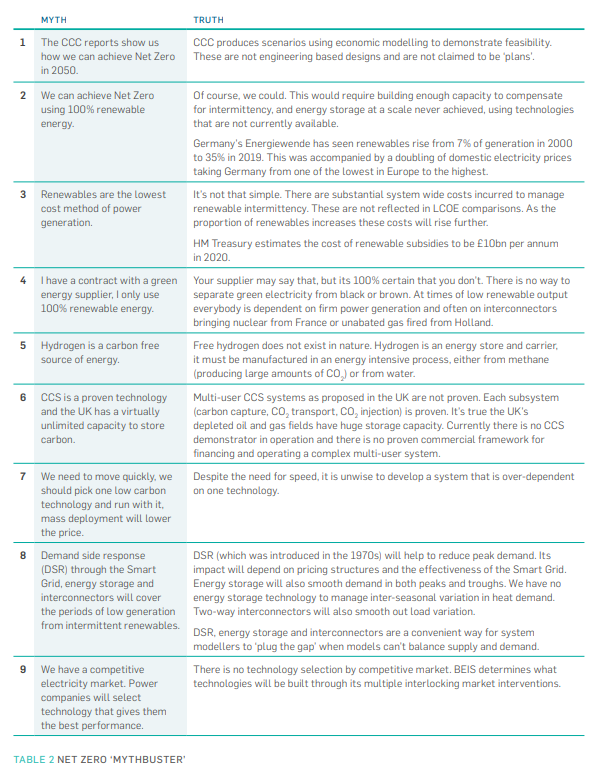
Let’s say we have a PDF report that contains a data table we want to visualize (see the example below). Using the built-in PDF connector, we can easily bring this data into Power BI and build powerful visualizations and reports.
Need Help Getting Started With Power BI?
Our Microsoft Certified consultants can help with the implementation of Power BI in your organization
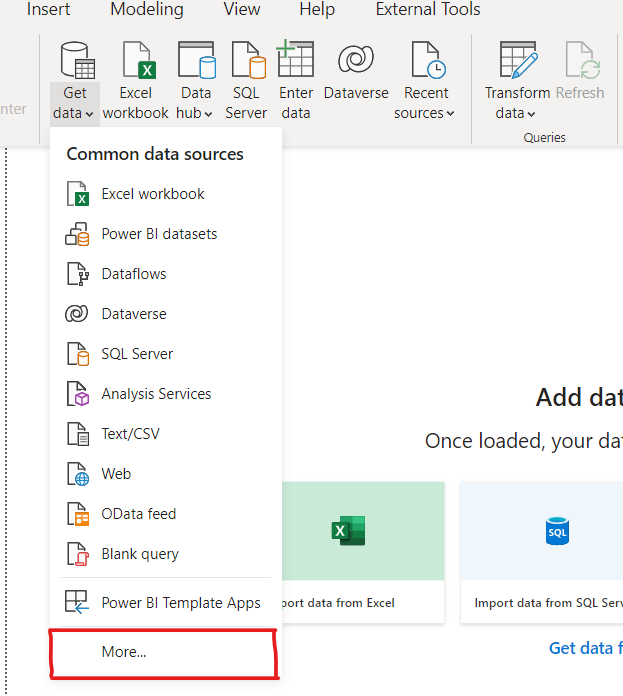
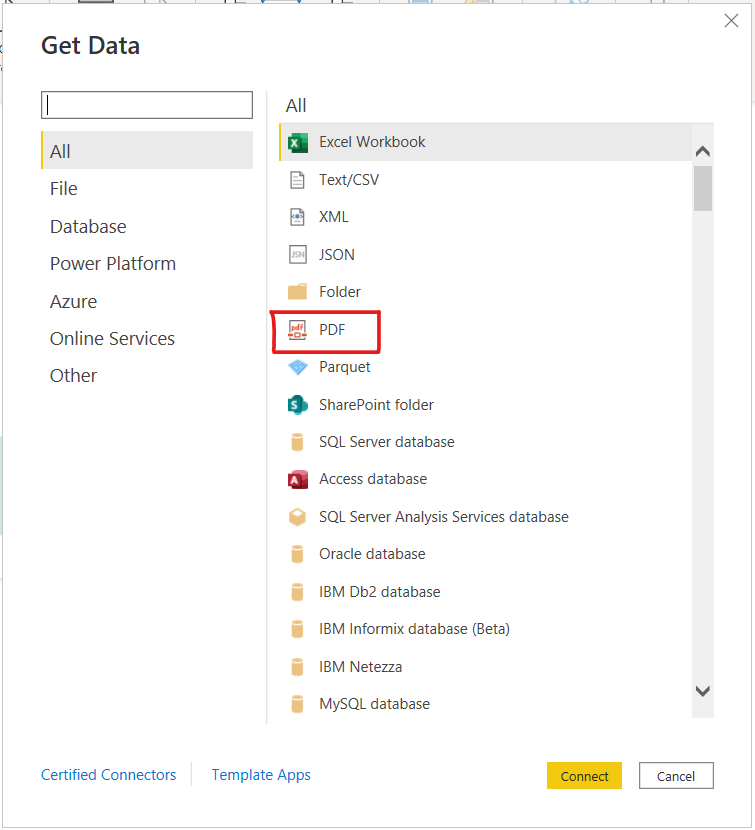
To connect to data in a PDF report from Power BI, first open the Power BI Desktop application. From the Home tab, click Get Data and click More… to open a dialog box with all available data sources. Select PDF from the list of available data sources.
Next, browse to the PDF report that you want to connect to and select it. Power BI will then open the report and display a preview of its contents. At this point, you will need find the table you wish to import to Power BI.
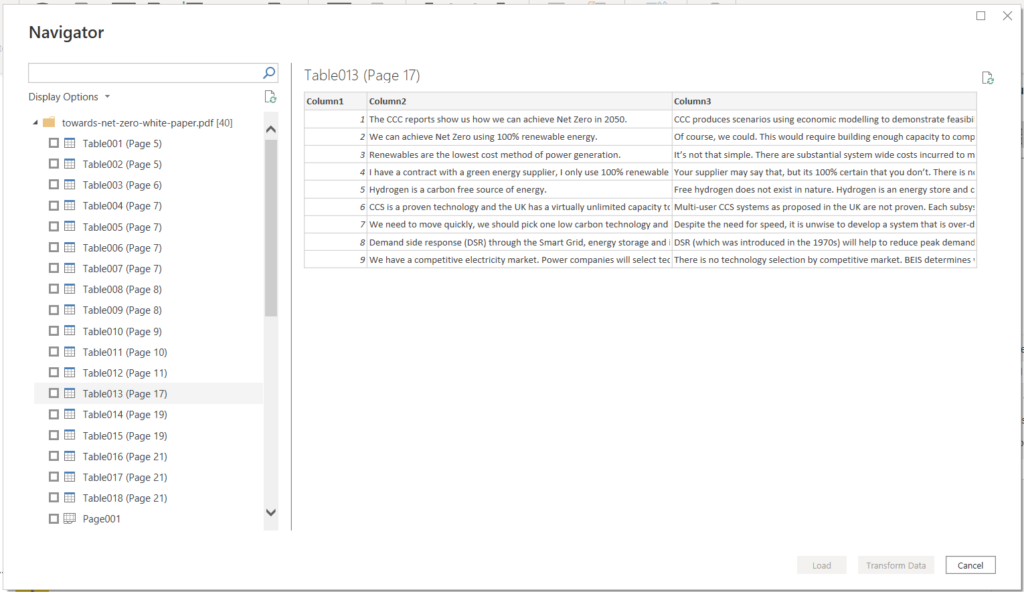
To import data from the PDF file into Power BI, you can simply click the Load button. Power BI will then extract the data from the PDF report and display it in a table format so that you can start creating visualizations.
The beauty of Power BI is that it also allows you to make transformations to your data before you add it to your data model. To make data transformations, such as adding or splitting columns and changing column names, click Transform Data. This will open the Power Query Editor, where you can use the user interface or Advanced Editor to get the data ready for visualizing.
Once the data has been cleaned and transformed, you can use it to create visualizations and reports. After the data is loaded to the data model, you can create relationships with other tables, create measures using the DAX language, or simply start visualizing this data by dragging it onto the canvas.
That’s it!
Connecting to data in a PDF report is a quick and easy way to import data from PDFs into Power BI. The native PDF connector does all the work for us, allowing us to create dynamic and interactive visualizations using data we have in a PDF report format.
Now you can go out there and start providing valuable insights into your data even if all you have access to is a PDF report.

![Read more about the article [How To] Connect to an Excel Workbook in Power BI Desktop](https://goanalyticsbi.com/wp-content/uploads/2022/11/Connect-to-Excel-in-Power-BI-300x157.png)