This one goes out to all or marketing friends who are creating and cultivating a data culture inside their units.
When it comes to measuring the effectiveness of marketing campaigns, understanding your audience, improving your website, or making data-driven business decisions, your website traffic information is key.
Google Analytics is certainly one of the most popular platforms for tracking website data for website and app owners as it provides a wealth of information about how visitors interact with their sites and apps – for free!
Although Google Analytics does provide its users with a dashboard to understand the metrics captured, it can sometimes feel limiting. The good news is that you can connect to your Google Analytics data directly in Power BI so you can have all the flexibility to visualize your website data in the way that makes sense for your business – and you don’t have to constantly be downloading Excel spreadsheets 😉.
In this blog, we explain how you can import data from Google Analytics into Power BI, so you can create stunning and interactive reports.
Step 1: Getting Accounts
Before you can import Google Analytics data into Power BI, you will need to make sure you have both a Google Analytics and a Power BI account. If you don’t have a Google Analytics account or a Power BI account, you can get one now by selecting the options below.
Step 2: Get Data
Once you have both accounts, you are ready to start importing your Google Analytics data. Power BI is set up with a Google Analytics data connector, so connecting to your website data is a straightforward process.
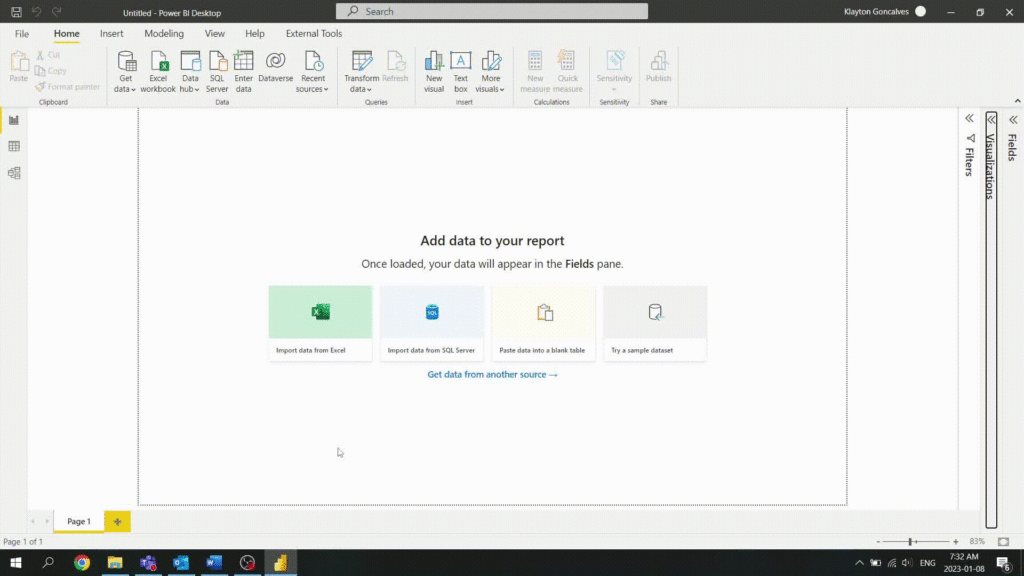
In the Power BI Desktop application, you can navigate to Get data from the Home tab and click More… to open the Get Data dialog box. Once the Get Data dialog box loads, you can use the search box to search for the Google Analytics connector.
Need Help Getting Started With Power BI?
Our Microsoft Certified consultants can help with the implementation of Power BI in your organization
Step 3: Login to Google Analytics
After selecting the Google Analytics connector from the Get Data dialog box and clicking Connect, Power BI will give you a warning about connecting to a third-party service.
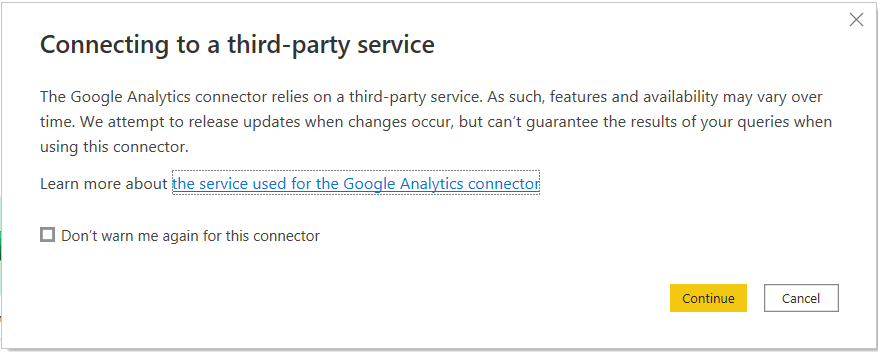
To connect to your Google Analytics data, you must understand and be okay with this limitation. If you are okay with connecting to this third-party service and understand how it can impact your query, you can click Continue.
Next, click Sign in.
After you choose your Google account and enter your credentials, you will receive a message stating: “Sign in complete. You can return to the application. Feel free to close this browser tab.”.
Step 4: Selecting Data
After you return to the Power BI Desktop application, you will see a message stating that you are currently signed in.
You can click on Connect to access your website data.
You will then see all your Google Analytics views and once you select the data you wish to visualize, you can either click Load to load your data directly to the data model or Transform data to open Power Query Editor and make transformations to your source data.
Once the data is loaded to the model, you are ready to start creating stunning visualizations.
It’s that simple to import your Google Analytics data into Power BI. Now you can have full autonomy to visualize your website data in the best way that makes sense for your business and have real-time information on how your website is trending – all without having to manually download any data from Google Analytics.
A Note About How Google Analytics Data is Stored
The Google Analytics views you can connect to are stored in a Cube.
In the context of data engineering, a “cube” generally refers to a multi-dimensional array of data that is organized and stored in a specific way to facilitate fast querying and analysis. Cubes are often used in business intelligence and data warehousing systems to enable users to analyze large amounts of data from multiple angles and perform complex calculations quickly.
A cube is typically composed of a set of dimensions, which are the various categories or attributes of the data, and measures, which are the numeric values being analyzed. For example, in Google Analytics we can have dimensions like “device,” “region,” and “time,” and measures such as “pageviews”. Users can then slice and dice the data by selecting different combinations of dimensions and measures to gain insights and answer business questions.
Cubes are often stored in an optimized format that allows for fast querying and analysis, such as using a multi-dimensional database or an in-memory data store. This makes it possible to quickly perform complex calculations and aggregations on large datasets, even when working with billions of records.

![You are currently viewing [How To] Import Data from Google Analytics into Power BI](https://goanalyticsbi.com/wp-content/uploads/2023/01/Blog-Feature-Image-Connect-to-Google-Analytics.png)
![Read more about the article [How To] Import Data from a File Stored in SharePoint into Power BI](https://goanalyticsbi.com/wp-content/uploads/2023/01/Connect-to-SharePoint-300x157.png)
