In all its greatness, Power BI still has some limitations. One of these is the inability to align (left or right) content in a single value card visual. While center-aligned content makes sense most of the time when you are visualizing a number, it becomes more limiting when you are using this visual to display some text you have dynamically generated using DAX formulas.
So, how do we get around this issue?
One way to get around this limitation is by using the Smart Narrative visual, which is a preview feature that Microsoft released with its September update. While Microsoft boasts the ability to automatically generate text with this feature, it can also be used for simpler things like creating dynamic titles and text.
Here is how we do it.
Step 1: Enable Smart Narratives Preview Feature
Before we can start using the Smart Narratives visual, we will need to have a Power BI Desktop version of September 2020 or newer and we will need to enable the Smart Narrative preview feature. If you already have both, you can skip to step 2.
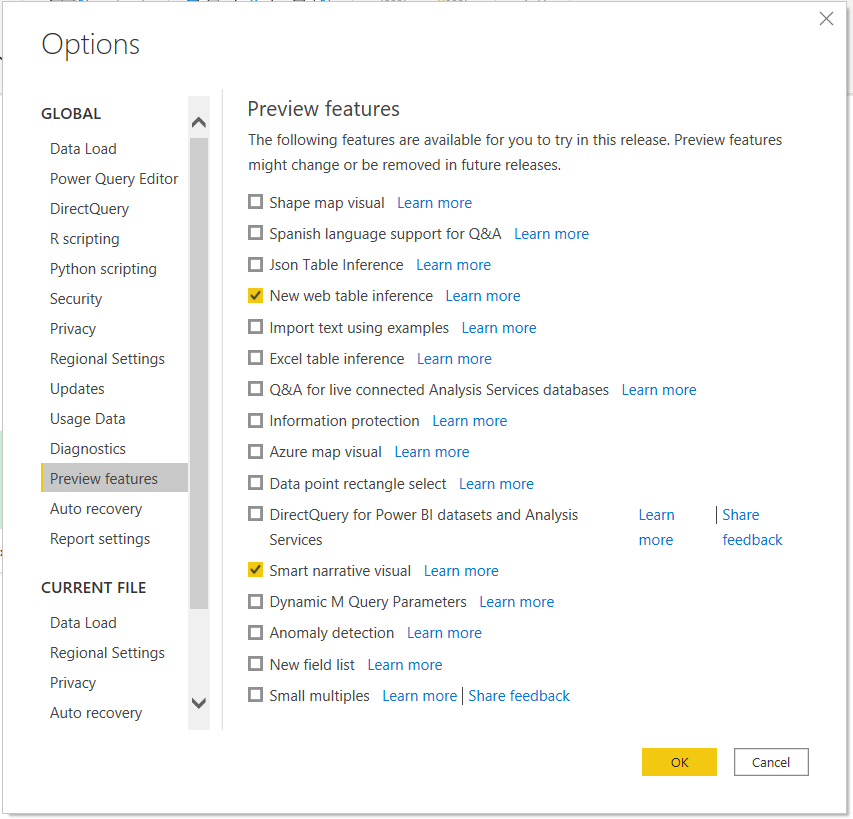
To enable the Smart Narrative visual, in Power BI Desktop, go to File » Options and settings » Options. When the dialog box opens, choose Preview features from the GLOBAL settings, check off the Smart narrative visual and click OK.
For the Smart Narrative visual to be available for use, you will need to restart the Power BI Desktop app.

Step 2: Create a Smart Narrative Text Box
After enabling the Smart Narrative visual, we can insert a Smart Narrative text box in two ways.
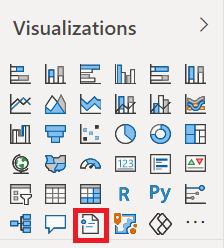
First, we can click on the Smart Narrative icon from the Visualizations pane. Note that adding a Smart Narrative visual in this way will create some auto-generated AI text based on any visuals you already have on the page. This is very useful if you are trying to get some insights from your data, but less useful if you are trying to create a dynamic title.

The second option is to add a text box as we normally would (clicking Text box from the Home tab or navigating to the Insert tab and clicking Text box). You will notice that there is now an extra banner under the usual text settings with two buttons: Value and Review. We will explore these next.
Step 3: Add and Edit Values in Smart Narrative Visual
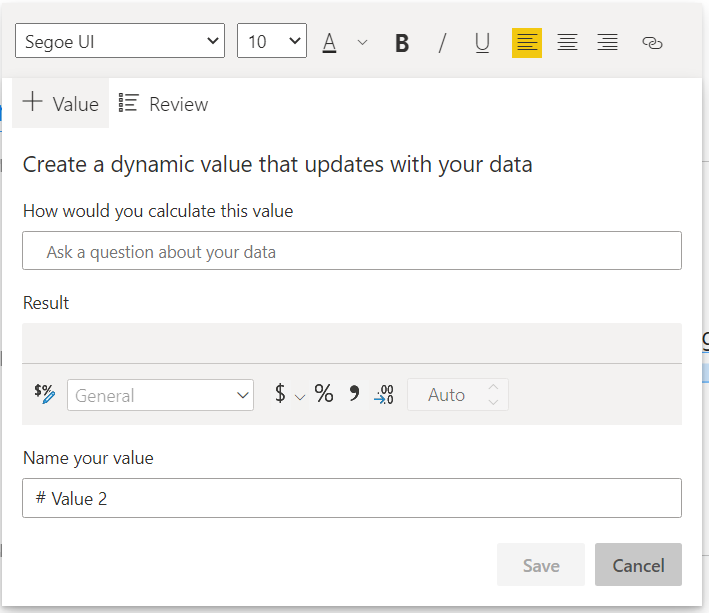
Adding our measures to our new text box is easy. We simply click the Value button, which opens a dialog box asking us to create a dynamic value that will update with our data.

The Smart Narrative visual uses the same AI as the Q&A feature, so we can use plain language to tell it how to calculate the value we want in the “How would you calculate this value” field. For example, we can type in Total Sales for Maria, which will give us the total sales for our salesperson Maria.
We can also just call on a single measure in our dataset. This is useful if we have already created a dynamic text measure using DAX or if we want to align a single number value left or right.
When we click save, our text will be displayed in the text box as any normal text. By highlighting the text, we can now make edits to our text alignment, as well as, our font styling.

Additionally, we can take this to the next level by adding some text to the left or to the right of our measure, while keeping our measure dynamic and interactive.
Notice that the text is underlined, which is Microsoft’s way of telling us this is a value versus normal text. By clicking on the underlined text, we will be taken to the Review dialog box, which is where we can change how to calculate our value in case we change our mind or made a mistake.
With the Smart Narrative visual we can now align our measure values left or right without being limited by the card visual. Though there is a lot more horsepower behind the Smart Narrative visual in terms of auto-generating insights, it can be used as a nice workaround to not being able to align text with the card visual.
Need Help Getting Started With Power BI?
Our Microsoft Certified consultants can help with the implementation of Power BI in your organization

![You are currently viewing [How To] Align single value card visual in Power BI](https://goanalyticsbi.com/wp-content/uploads/2021/01/Align-Card-Visual.png)


![Read more about the article [How To] Import data from PDF into Power BI](https://goanalyticsbi.com/wp-content/uploads/2022/12/Import-From-PDF-300x157.png)