In this blog post, we explain how to append queries in Power Query. The steps explained below apply both in Power BI and Excel.
NOTE
Screenshots of Power Query in this blog are from inside Power BI, but the user interface in Excel is similar.
In the dynamic world of data analytics, the process of efficiently managing and joining data from multiple sources can often pose challenges. One particular join that you may be required to perform on your datasets is to append them together – or stack data from one dataset on top of another. Power Query, a tool available in both Power BI and Excel, offers functionalities that can make this task much simpler.
The following scenario should exemplify the process of appending multiple datasets together using Power Query.
The Scenario
In this scenario, you are a data analyst for a small shop that has been growing and hiring a few additional employees over the years (from 2010 to 2013).
You are tasked with creating a dashboard of the employees in the firm that should always reflect the latest headcounts and provide some basic demographic information about the employees.
The human resources department starts a spreadsheet with new hires each year and they periodically add new employees that are hired during that year. These spreadsheets are available to you in a SharePoint file folder.
Because you work for a small shop, you are a one-person data team – yay! So, you need to automate the process of gathering the data and refreshing the dashboard as much as possible to avoid consuming too much of your time.
The Challenge
At its core, appending queries refers to the process of vertically combining data from multiple tables – or queries. Imagine having several pieces of a puzzle, and you need to put them together to view the complete picture. Each piece represents a separate table of data, and the act of joining them forms the appended query, creating a cohesive dataset. The columns of each table align with one another, ensuring data consistency.
In the scenario described above, you load each separate table with new hires for specific fiscal years to Power Query and you need to combine them to create a single dataset.
Download sample data and .pbix files
Want to follow along with our example? Download our free sample data and Power BI files.
-
Free Power BI Template for Appending Queries Streamline your data modeling with this comprehensive Power BI downloadable package! Designed for...
-
Free Power BI Template for Appending Queries Streamline your data modeling with this comprehensive Power...
Appending Queries
When appending queries in Power Query, there are some things you should look out for. Below we explain what these things are, show you the steps to perform the append operation, and discuss some optimization solutions.
Ensure Column Consistency Across Tables
When appending queries together in Power Query, the first thing to consider is whether you have consistent columns across all queries (data tables). For a successful appending process, the column names across all tables must match.
However, there can be instances where certain columns are present in one dataset and missing in others.
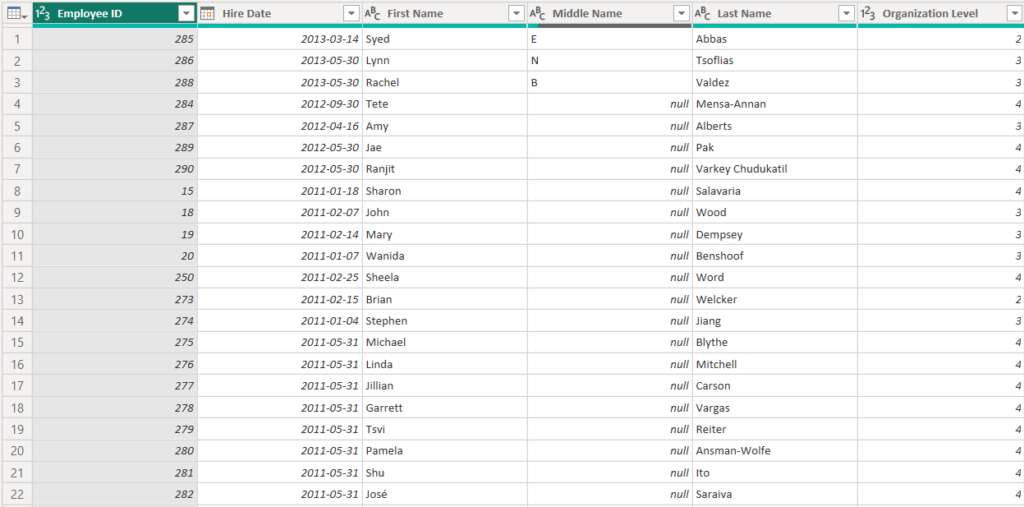
For instance, the data provided for the scenario above highlights the presence of a [Middle Name] column only in the 2013 data, which is not present in the other tables. Power Query effectively handles such discrepancies by filling the missing columns with null (empty) values, ensuring the integrity of the appended dataset. Still, users should consistently audit their datasets for disparities.
Executing the Append Operation in Power Query
To execute the append operation in Power Query, follow the steps below.
Start by selecting your data – choose the tables you wish to append.
Navigate to the Home tab to find the option ‘Append Queries’. You have the option to append queries into an existing data table by selecting ‘Append Queries’ or you can append your data as a new query by selecting ‘Append Queries as New’.

Choose the number of tables to append – you can opt for appending two tables or more than two.
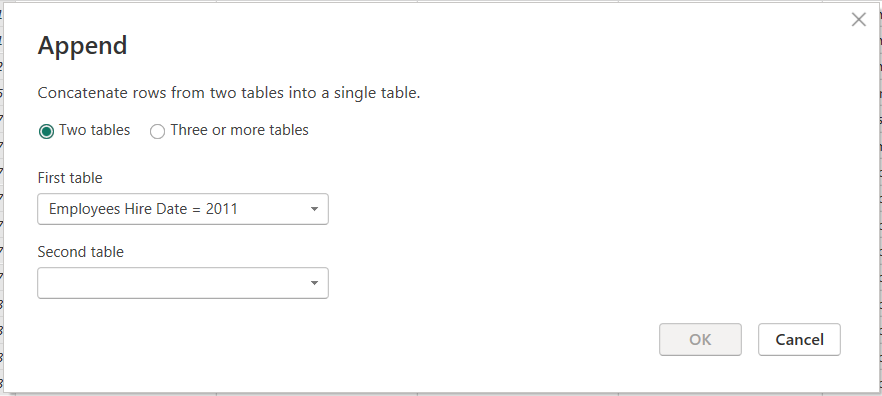
Specify the tables – highlight the tables you wish to append from the available list.
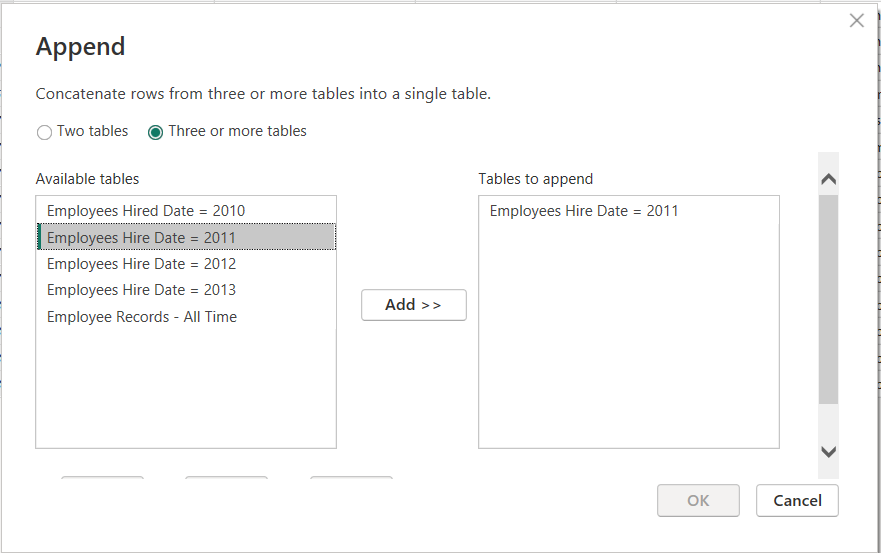
Finalize the append – once satisfied, confirm the operation. The result will be a new dataset that vertically combines the data from the tables you selected.
Optimizing the Data Model
After the append is complete, it is important to realize that all queries will be loaded into the data model. But, since you now have a combined dataset, it is redundant for you to also load the individual tables to the data model. Moreover, this might create confusion if you share your report with colleagues.
The best practice here is to prevent the individual tables from loading to the data model. To do this, simply right click on each individual table and deselect ‘Include in report refresh’.
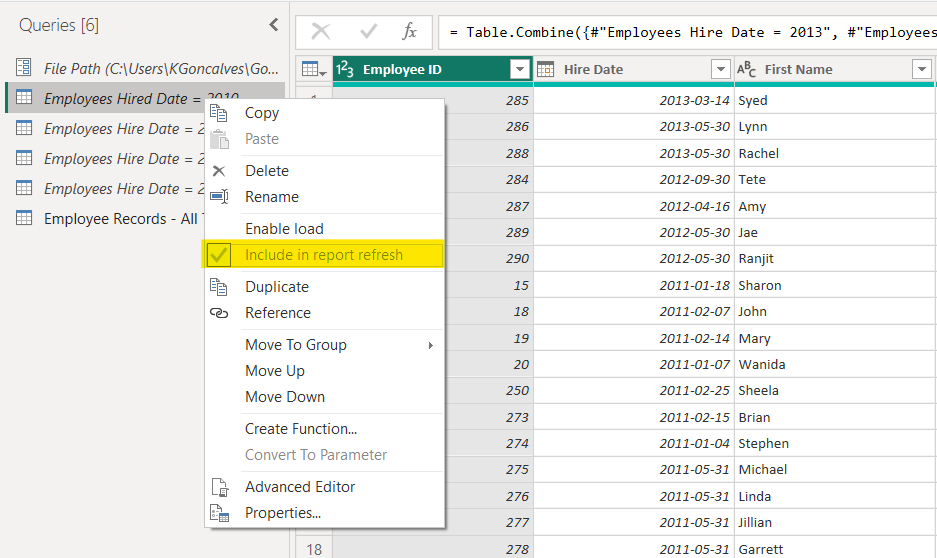
In Power Query, you can differentiate between queries that will be loaded to the data model versus those that will not by looking at the formatting under the Queries pane. Queries that will not be loaded to the data model will be displayed in italics.
With your combined dataset ready, you can now proceed to visualize the data, crafting insightful graphs, charts, and reports.
Need Help Getting Started With Power BI?
Our Microsoft Certified consultants can help with the implementation of Power BI in your organization
Want to build reports that work? Download our free Power BI report design checklist!
We put together a simple, actionable checklist to guide you through the process of designing Power BI reports that deliver results.
-
Unlock the secrets to creating impactful Power BI reports with our free, actionable checklist. From defining audience needs to optimizing...
-
Unlock the secrets to creating impactful Power BI reports with our free, actionable checklist. From...

![You are currently viewing [How To] Append Queries in Power Query (Power BI & Excel)](https://goanalyticsbi.com/wp-content/uploads/2023/10/Appending-Queries.png)



![Read more about the article [How To] Import Data from SQL Server into Power BI](https://goanalyticsbi.com/wp-content/uploads/2023/01/Blog-Feature-Importing-data-from-SQL-Server-to-Power-BI-300x157.png)
![Read more about the article [How To] Connect to Web Data Sources in Power BI](https://goanalyticsbi.com/wp-content/uploads/2023/01/Connect-to-web-data-sources-in-Power-BI-300x157.png)
Hi Thanks putting this together! I question what AI will do in this area over the next five years.
Hi Gerald,
Thanks for the comment – it’s definitely something to keep a look out for. I think while AI offers great potential for easily repeatable tasks, it will take a while before it is able to understand business-use cases.