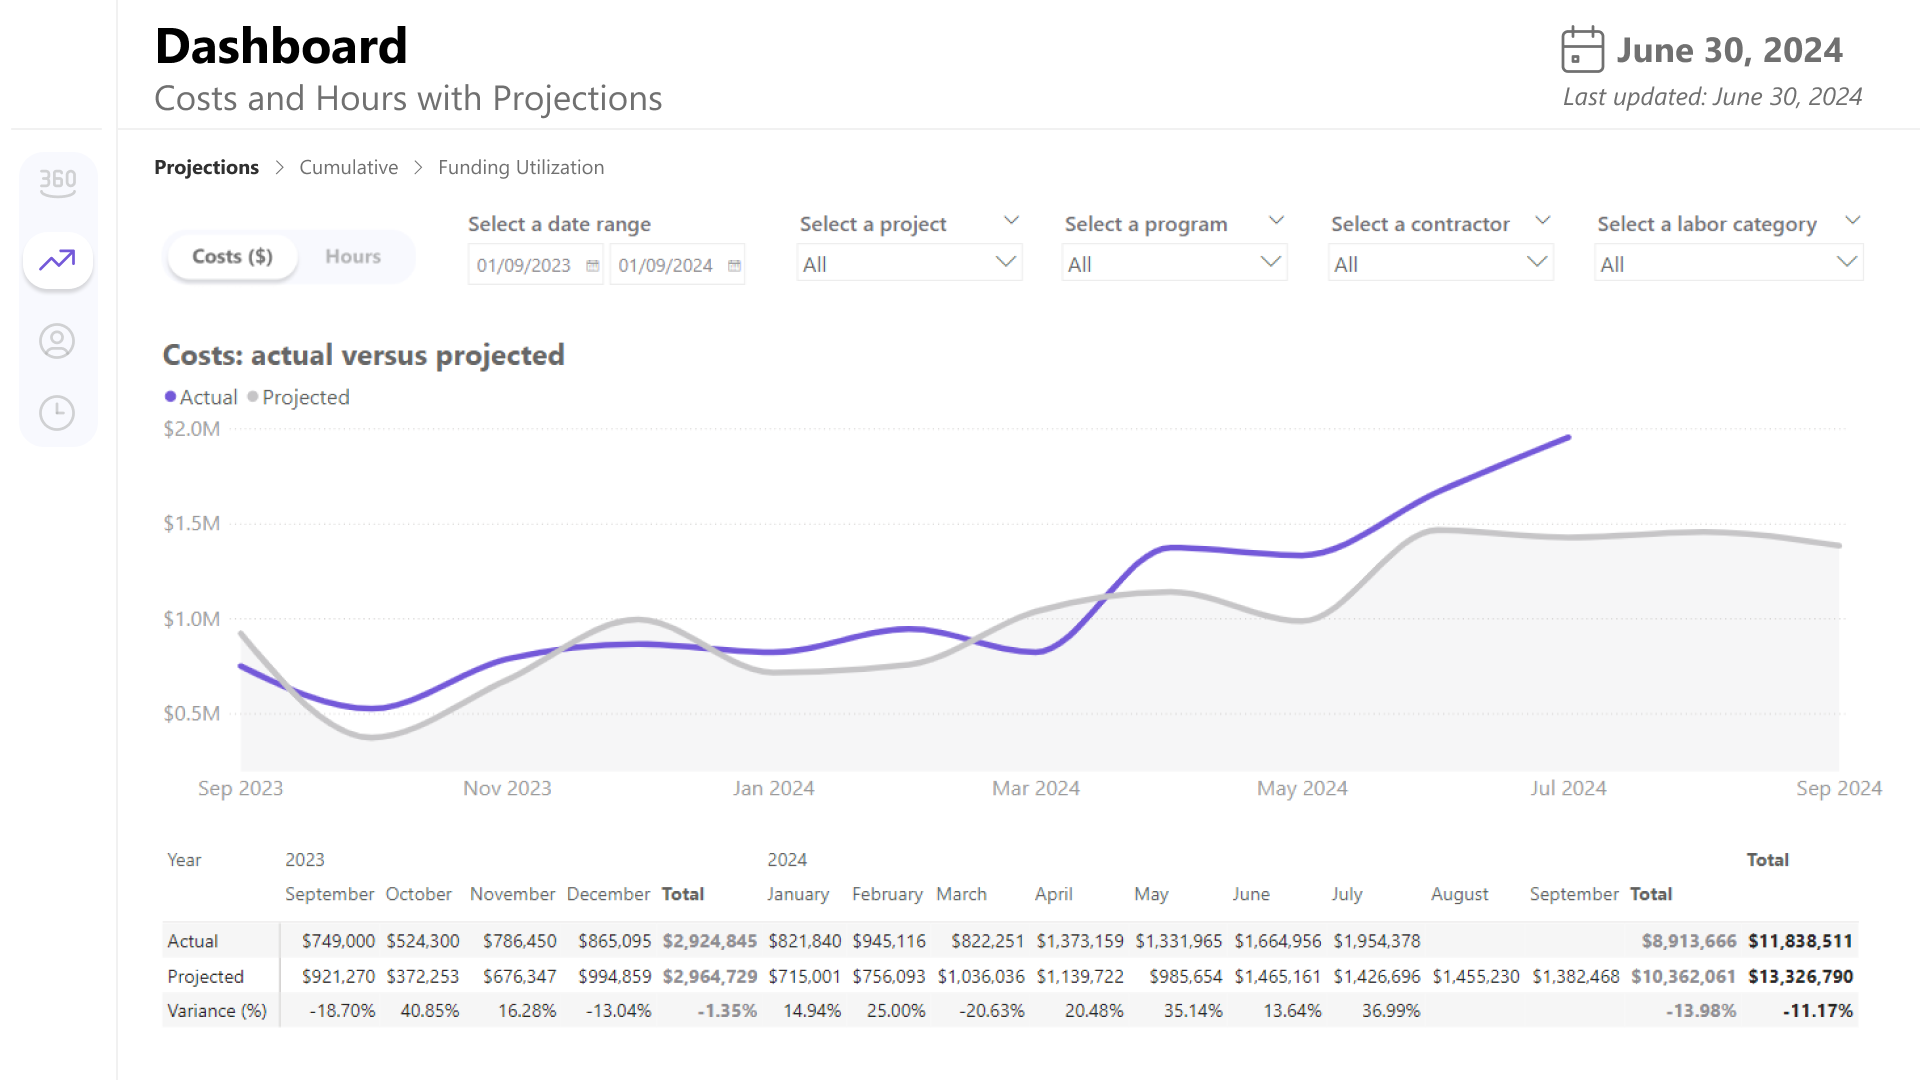
Go Analytics built a custom Power BI dashboard, enabling real-time insights, anomaly detection, and dynamic forecasting – all while preserving Excel workflows.
- Power BI Consulting
- Data Visualization
Overview
A staff-augmentation and contracts management consulting firm partnered with Go Analytics to develop a comprehensive Power BI dashboard for their client in the healthcare technology industry. The goal was to consolidate financial and human resources data across multiple staff augmentation contracts, providing real-time insights into budget utilization, forecasting, and anomaly detection.
Note: due to sensitivity and confidentiality, the client will remain unnamed in this case study.
Go Analytics implemented a robust extract, transform, load (ETL) process, designed an intuitive, visually stunning dashboard, and provided ongoing support to ensure seamless adoption. The result? A scalable, data-driven reporting system that allows stakeholders to monitor contracts, optimize resource allocation, and make informed decisions – all without disrupting existing Excel-based workflows.
About the Client
Our client is a specialized consulting firm that provides staff augmentation and data-driven solutions to government agencies and research institutions. With a focus on biotechnology, healthcare, and public sector projects, the client supports organizations in managing large-scale contracts, optimizing workforce allocation, and ensuring compliance with regulatory standards.
For this project, the client leveraged Go Analytics’ expertise in Power BI to enhance reporting and decision-making capabilities for their client. By integrating advanced business intelligence solutions, the client streamlined contract management, reduced manual reporting burdens, and improved financial oversight.
Challenge: Data Transformation Without Disruption
One of the biggest hurdles in this project was designing an ETL (Extract, Transform, Load) process that could prepare data for Power BI without altering the Excel-based workflow that our client and their client relied on for staff augmentation and contract tracking. The existing data structure was formatted as a matrix, requiring transformation into a tabular format suitable for Power BI, all while ensuring that Excel remained fully functional for day-to-day operations.
Additionally, the client required a dashboard that wasn’t just functional – it needed to be aesthetically outstanding. The visualizations had to engage users and deliver insights in a clear and interactive format.
Another challenge was building a forecasting model with dynamic parameters. The dashboard needed to allow users to adjust projections based different assumptions around the number of new personnel onboarded, the number of working hours, and average bill rates.

Solution: A Strategic Power BI Implementation
To address these challenges, Go Analytics designed a custom ETL pipeline in Power Query that automatically transformed and structured data for Power BI analysis while preserving the integrity of the monthly-updated Excel spreadsheets. This allowed the team to continue using familiar tools for data entry while benefiting from real-time insights in Power BI.
The dashboard was developed with:
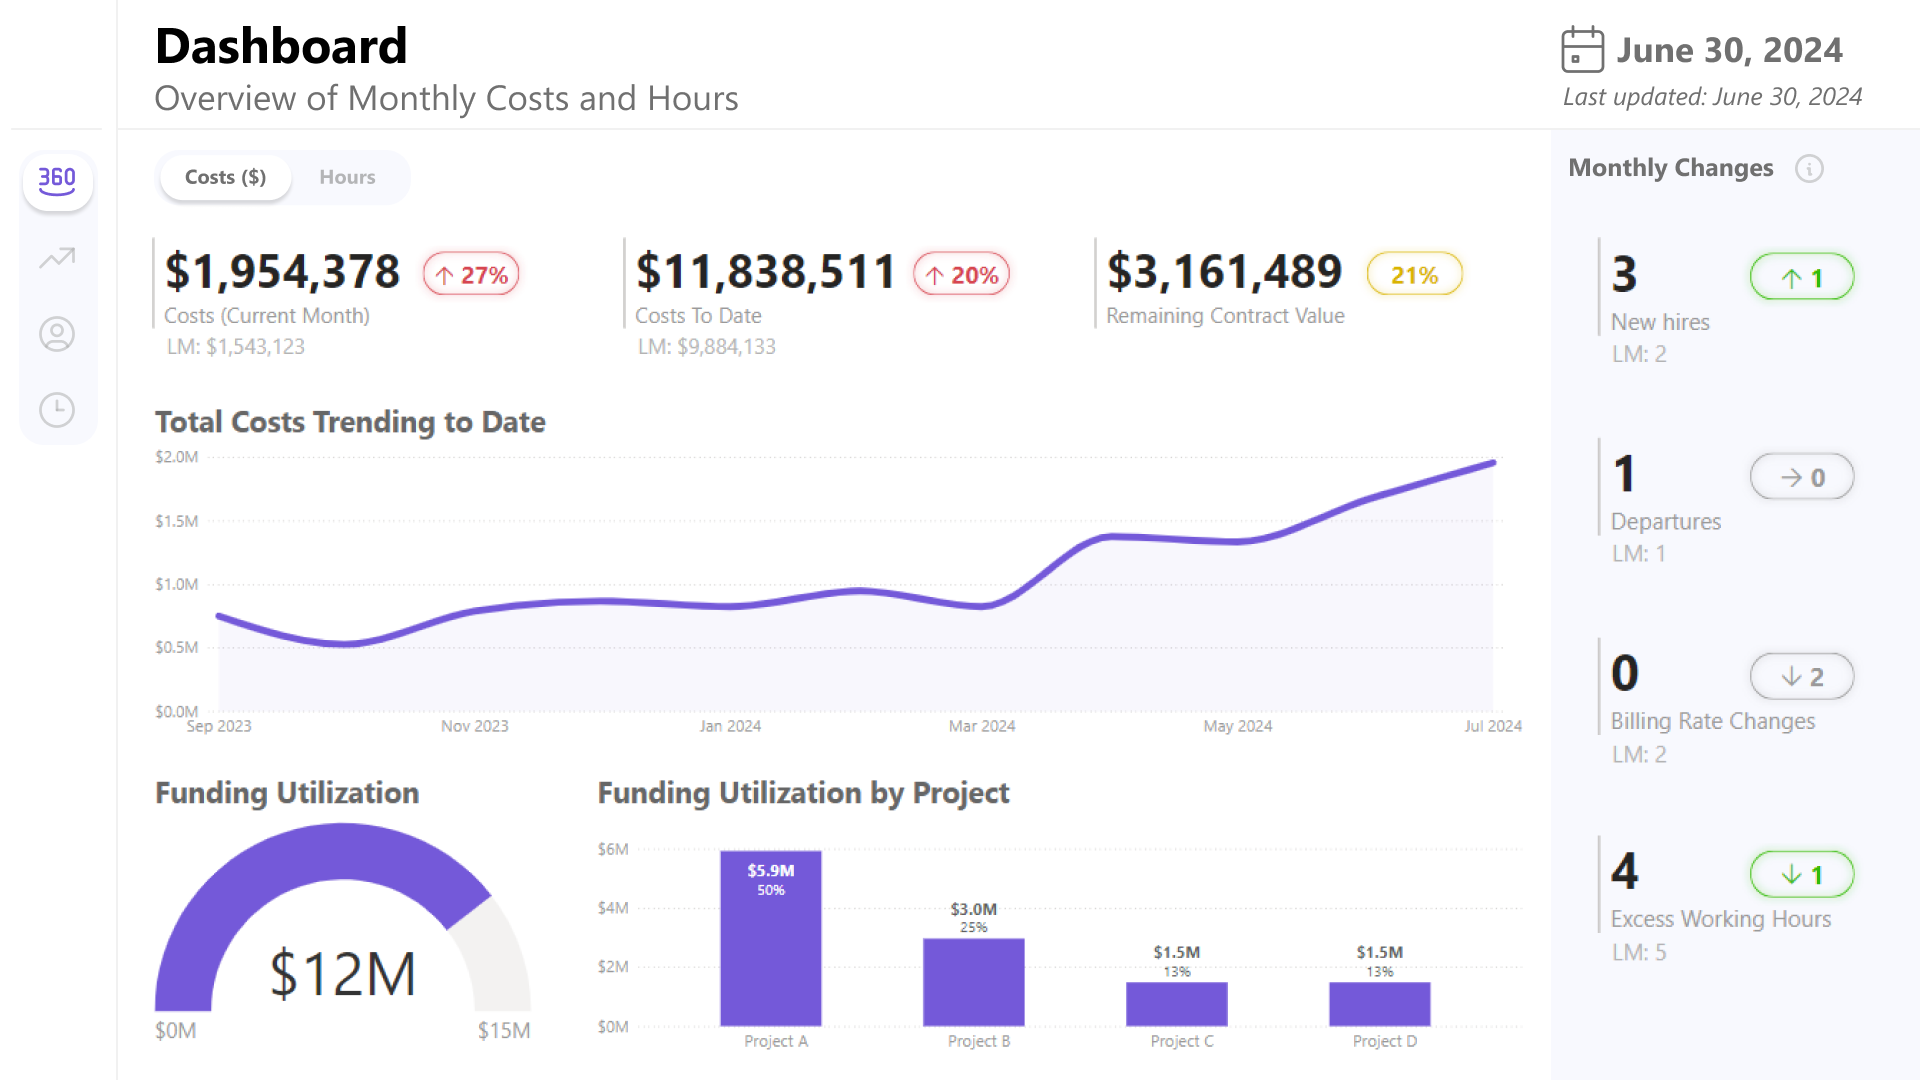
- Anomaly detection – Highlighting unusual trends in month-to-month resource utilization and billing rates.
- Dynamic forecasting controls – Allowing users to adjust financial projections across three key dimensions: number of personnel, number of workings, and billing rates.
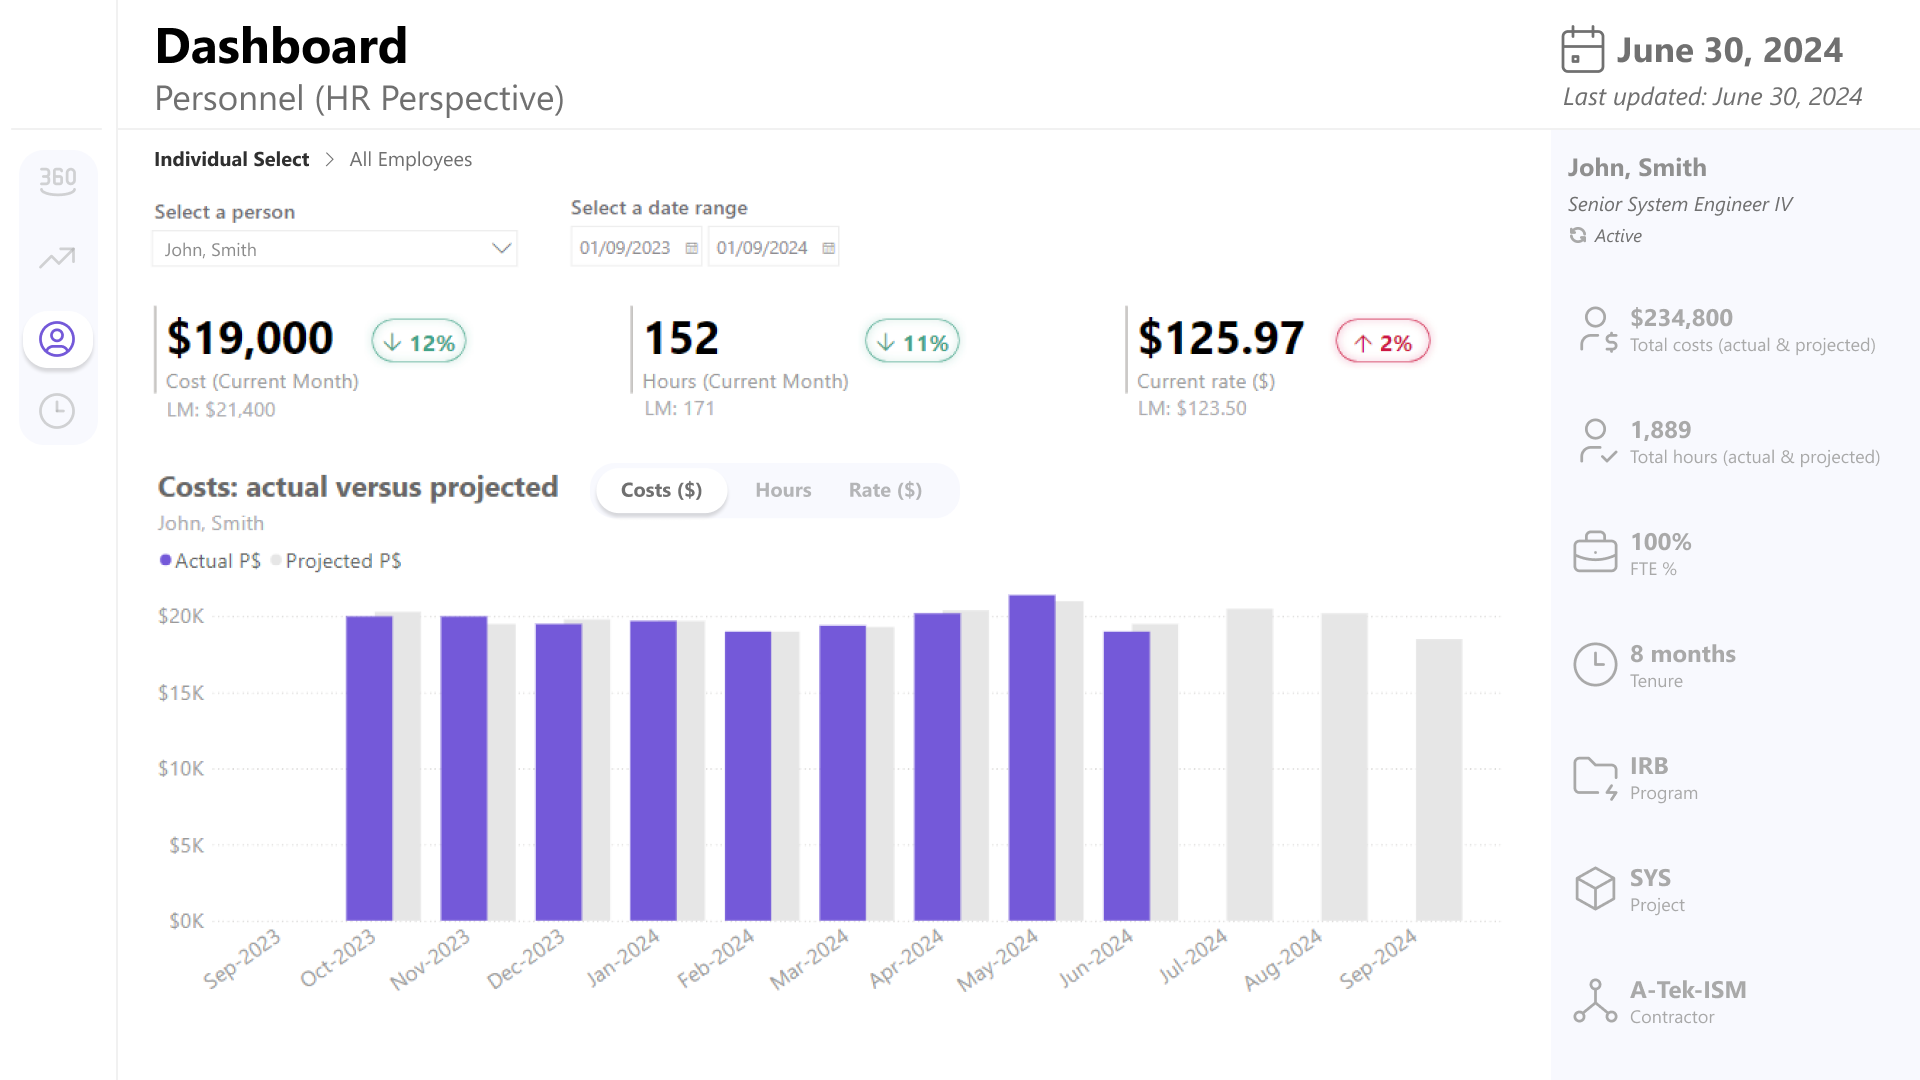
- Interactive drill-through capabilities – Enabling detailed exploration of contract performance at a macro and micro level.
- Stunning visual design – Ensuring a professional, branded, and highly engaging reporting experience.
Additionally, Go Analytics provided training to the teams involved to demonstrate how the dashboard can enhance their data-driven decision-making processes.

Results: Scalable Insights, Improved Decision-Making
The Power BI implementation provided our client and their client with a centralized, real-time view of contract performance and resource utilization. The intuitive dashboard now provides several benefits to the team, including allowing them to:
- Identify budget risks early and take proactive measures
- Reduce manual reporting by automating data processing and visualization
- Increase engagement with an interactive, visually compelling dashboard
- Streamline forecasting with parameter-based adjustments for financial planning
By implementing a strategic data approach and designing a sustainable BI environment, Go Analytics delivered a solution that not only solved immediate reporting challenges but also laid the foundation for future BI expansion.
Need Help Getting Started With Power BI?
Our Microsoft Certified consultants can help with the implementation of Power BI in your organization
