

In this blog post, we explore the integration of Power BI and PowerPoint – something Microsoft has dubbed Storytelling with PowerPoint.
Released in May 2022, Storytelling with PowerPoint is another one of those reasons why you might choose Power BI over other data visualization tools. This Power BI integration allows users to tell data stories in the familiar embrace of PowerPoint – and with live, interactive data.
The integration of Power BI and PowerPoint takes your data presentations to a whole new level, allowing you to slice and dice your data and answer those crucial questions for decision-making in real time – no more “I’ll look into that and get back to you”.
What we are talking about here is the ability to connect to a live Power BI report and interact with it as if you were in the Power BI Service, except you’re doing it inside a PowerPoint slide. Whether you are in edit mode or in presenter mode, you will be able to drill-down and drill-through so that you can present insights in a dynamic and engaging way.
Okay, by now you should be convinced that this is an awesome feature and are now eager to get started integrating your reports in PowerPoint.
Need Help Getting Started With Power BI?
Our Microsoft Certified consultants can help with the implementation of Power BI in your organization
Getting Started
Adding a live Power BI report page to PowerPoint is an easy process that begins with getting the URL to the desired report page. With the URL copied, you are ready to paste it into the Power BI add-in in PowerPoint.
You can get the report page URL by using the Share or Export buttons in Power BI Service, or by copying the link from the browser’s address bar. Keep in mind that copying the link from the address bar will not preserve the current state of the report. For example, if you have applied filters or bookmarks and you wish these to be preserved in PowerPoint, then you should use the Share or Export buttons.
Get URL With Share Button
To get the URL using the Share button in Power BI Service, follow the steps below:
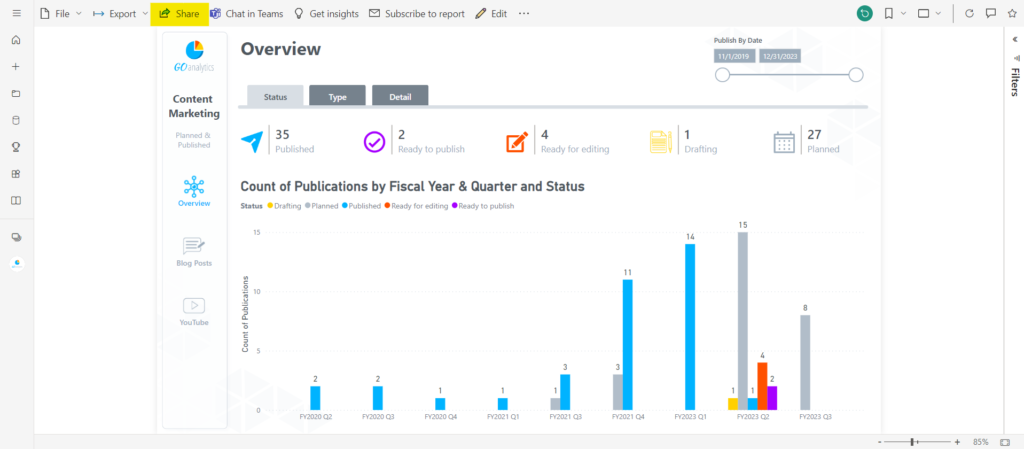
- In the Power BI Service, open the report to the page you want to insert and click the Share button.
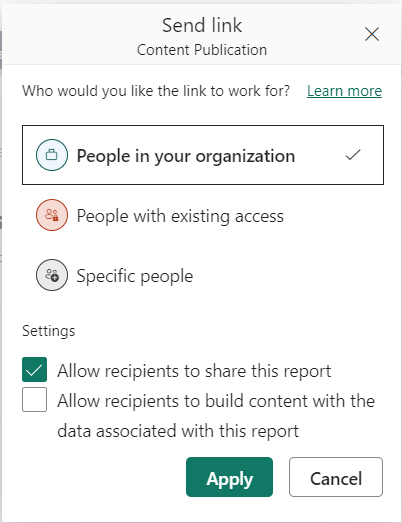
2. Choose the permissions you want to apply to this report.
3. Select whether you want to include your changes. By default, this option is selected. Deselecting it will reset all filters, selections, slicers, etc. to default when you embed this report page in PowerPoint.
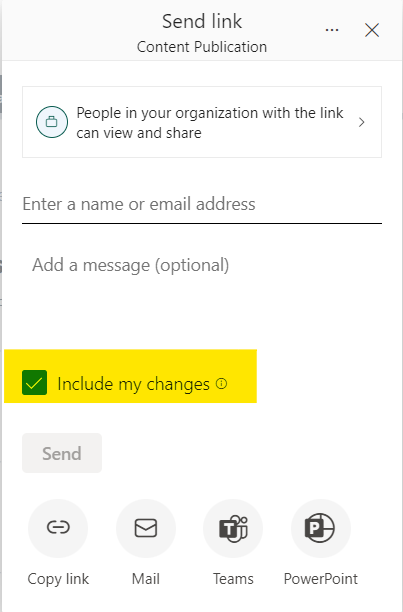
4. Click the PowerPoint icon and copy the URL. Alternatively, you can click Open in PowerPoint to open a new PowerPoint file.
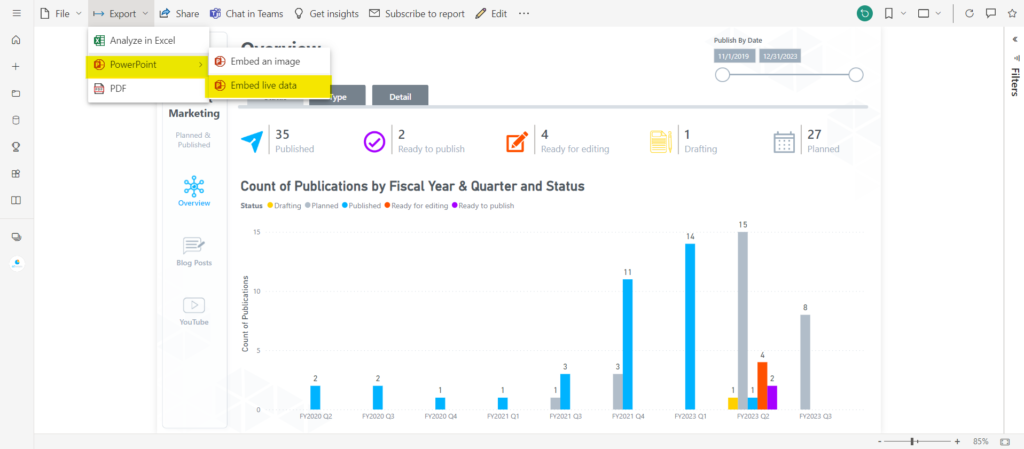
Get URL With Export Button
To get the URL using the Export button in Power BI Service, follow the steps below:
- In the Power BI Service, open the report to the page you want to insert.
- Choose Export, select PowerPoint, and then select Embed live data.
3. Select whether you want to include your changes (Embed report with the data filters you selected). By default, this option is selected. Deselecting it will reset all filters, selections, slicers, etc. to default when you embed this report page in PowerPoint.
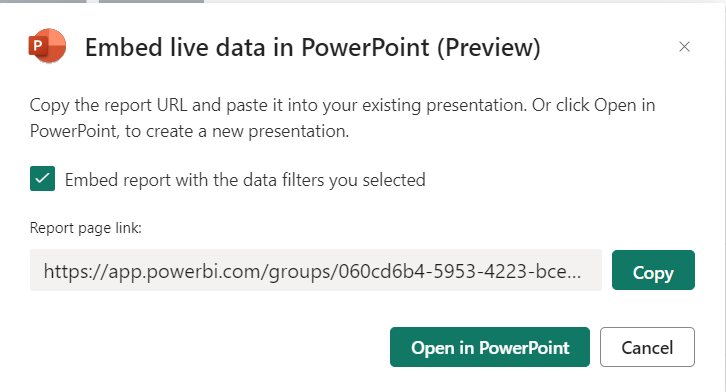
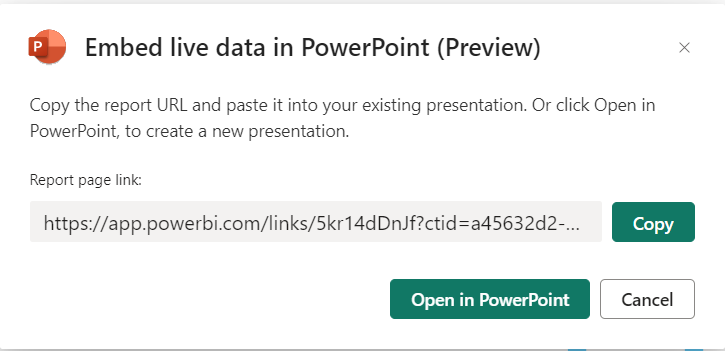
4. Click Copy to copy the URL. Alternatively, you can click Open in PowerPoint to open a new PowerPoint file.
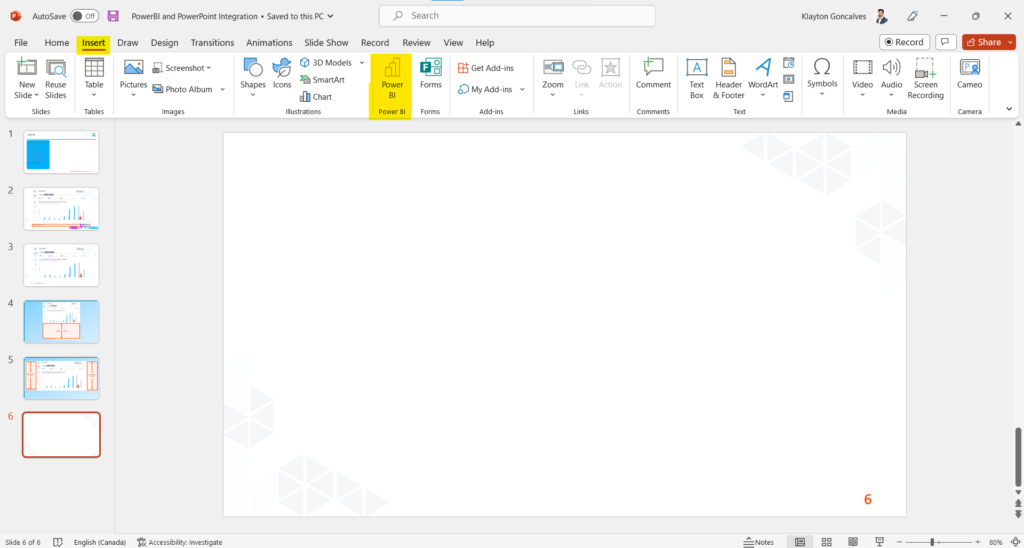
After copying the report page URL, you are ready to embed your report page into PowerPoint. Navigate to PowerPoint and the slide where you wish to embed your report page. From the Insert tab, select the Power BI button.
Note: if you don’t see the Power BI add-in, click Get Add-ins, and look for “Microsoft Power BI”. If you still don’t see it, your admin may have disabled the use of this integration.
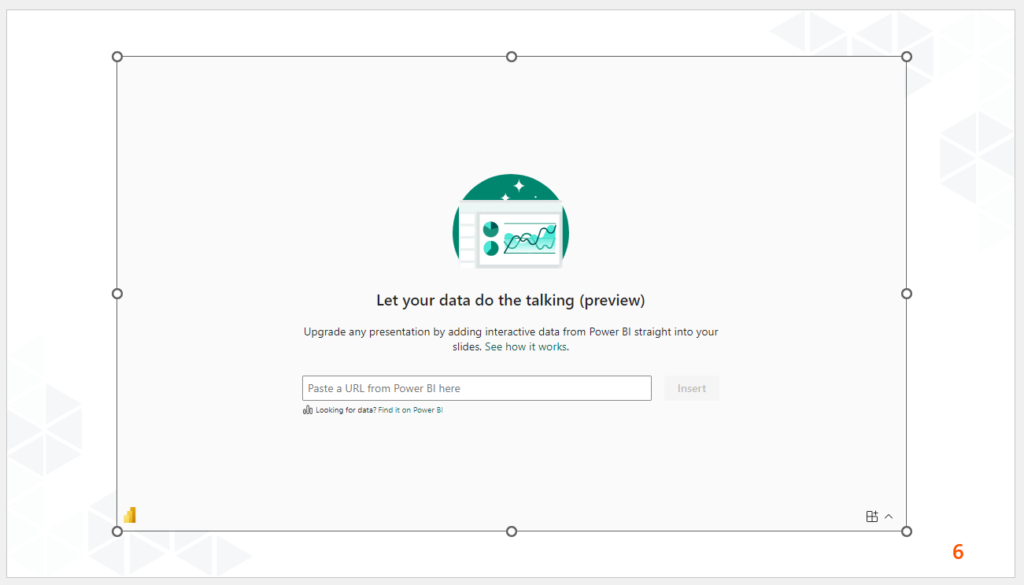
Next, paste your report URL into the text box and click Insert. You will notice your Power BI report page load into PowerPoint.
Working With Power BI Reports in PowerPoint
Through the Power BI add-in, Microsoft has made available the integration of individual report pages between Power BI and PowerPoint. Once you load a report page, you will notice that the left pane which is available in the Power BI Service to allow users to switch between report pages is unavailable. This means that you can only integrate one specific report page within a Power BI add-in in PowerPoint. However, if you have navigation built into your report such as using buttons to navigate to a different report page, this will work normally as it does in the Power BI Service.
When you integrate a Power BI report page in PowerPoint, the report page will be fully interactive, including the ability to drill-down, cross-filter, hover over data to see tooltips, and everything else you can expect from your report in Power BI Service.
Toolbar Across the Bottom
Across the bottom of the Power BI add-in, you will notice a toolbar that gives you some information about your report page and some controls that allow you to get the most out of your experience. This toolbar can be collapsed and expanded by using the up (︿) and down (﹀) chevron on the right side of the toolbar.
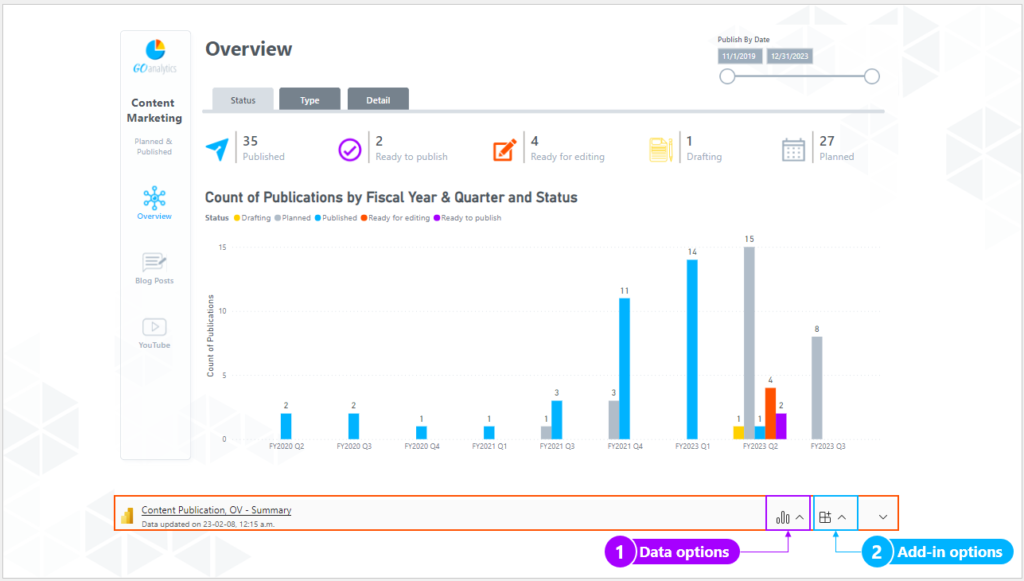
The toolbar will show the report title and page name, as well as when the data was last refreshed. This allows users to know exactly what they are looking at and whether they are viewing the latest data available.
For controls, you will be able to use the Data options ➊ and the Add-in options ➋ menus to enhance your experience.
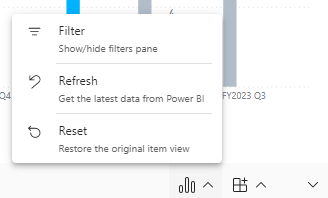
From the Data options menu, you can select Filter to show or hide the filters pane. This option is only available if filters have been set up using the filters pane in the report design process. You will also be able to click the Refresh button to refresh the data and the Reset button to restore the report page to the state it was in when it was first added to PowerPoint (this does not undo your changes prior to copying the URL).
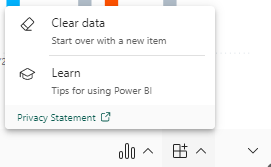
The Add-in options menu gives you two options: Clear data and Learn. Clicking Clear data will remove your report page from the Power BI add-in, allowing you to enter a new report page URL. The Learn button opens the Power BI help pages.
Power BI Add-in Side Menu
There is an additional menu available to users using this integration – the add-in side pane. It can be expanded by clicking the left chevron (〈) on the top right of the Power BI add-in. Let’s explore some key functionalities available from this menu.
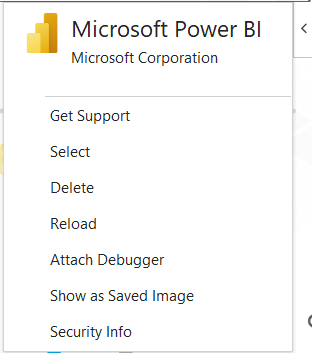
- Get Support – opens the Power BI support webpage.
- Select – selects the Power BI add-in in your slide.
- Delete – deletes the Power BI add-in from your slide.
- Reload – reloads the Power BI add-in, bringing in any structural changes to your report page that were made post your PowerPoint integration. This is different from the Refresh button in the Data options menu, which will refresh the data only.
- Show as Saved Image – freezes your report page as an image so it will not be refreshed with any new data. You can click this button again to reinitiate your live connection to the report page.
Licensing Requirements
The licensing requirements for embedding Power BI reports in PowerPoint are the same as sharing reports from the Power BI Service; if your organization is working on Power BI Premium Capacity licensing, then the report viewer only needs a Power BI Free license. However, if your organization is running on Power BI Pro or Power BI Premium Per User then both the individual sharing the report and the individual viewing the report will need a license.
Currently, B2B use cases are unavailable with Storytelling with PowerPoint.
Considerations, Limitations and Lessons Learned
Storytelling with PowerPoint is a seriously powerful integration between Microsoft’s data visualization and presentation software. But, as it is with all software, there are always some considerations and limitations. As we dove deep into this integration, the following are some key considerations, limitations and some lessons we learned along the way:
1. The resolution of your Power BI report is carried into PowerPoint
Something to consider before you embed your report page into PowerPoint is that the resolution will be carried in from Power BI.
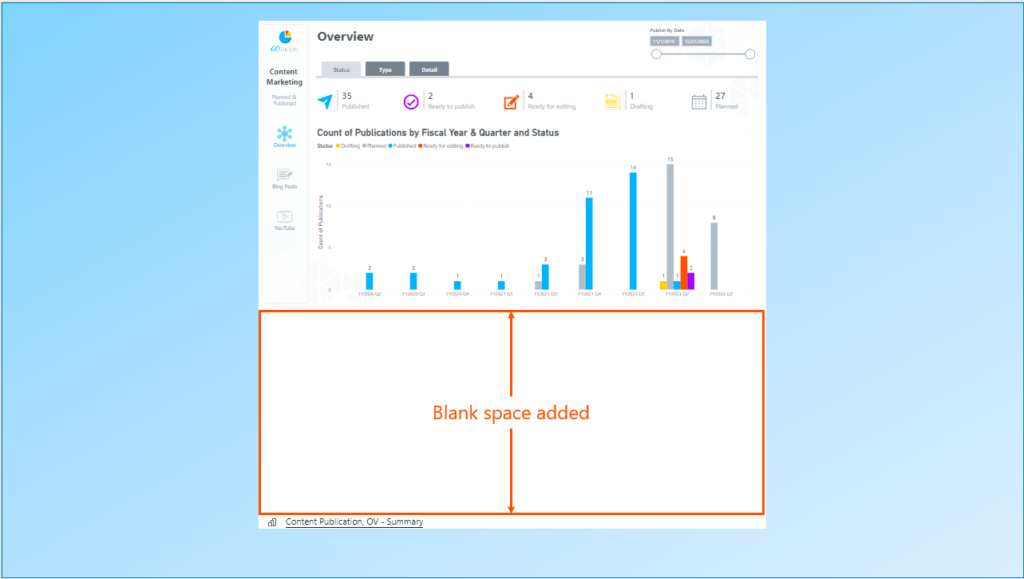
If your desired Power BI add-in shape is square and your report page was designed as a rectangle, you will get added blank spaces in the Power BI add-in to make up for the differences.
In the example below, notice the blank space added because the Power BI add-in was set to 16cm x 16cm (a square) but the Power BI report page was originally set to the standard 16:9 ratio (a rectangle).
Similarly, if the Power BI add-in is much wider than the Power BI report page then blank space will be added to your Power BI add-in view (see below).
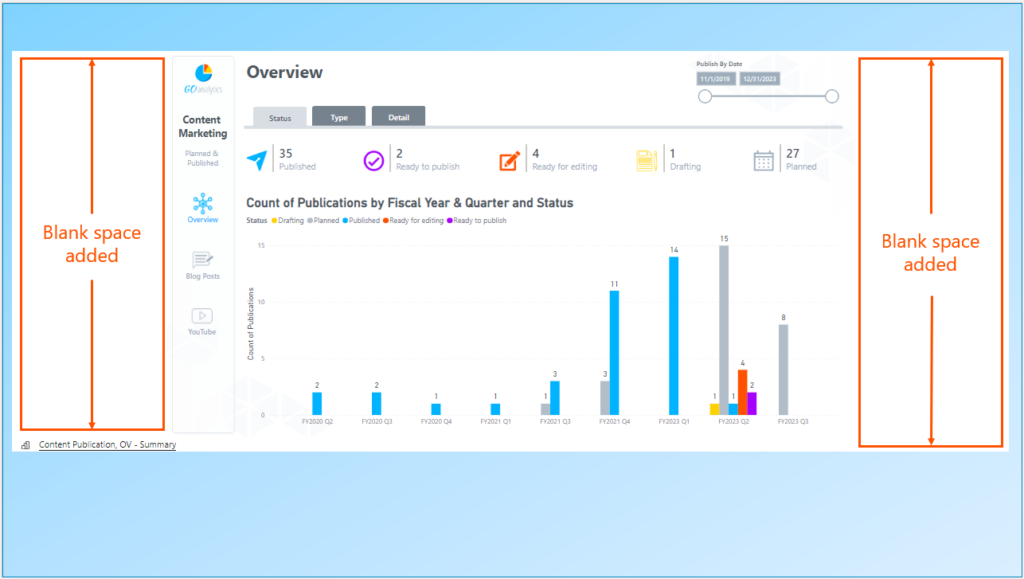
The solution here is to either set up the appropriate resolution in your Power BI report page or ensure that you scale your Power BI add-in in PowerPoint according to the resolution of the Power BI report page.
2. The Power BI add-in in PowerPoint does not support transparent background
One disappointing feature of Storytelling with PowerPoint is that the Power BI add-in does not support transparent background, even if your Power BI report page background is set to 100% transparency. From a design perspective, this can be frustrating especially if you are trying to incorporate your Power BI add-in into a corporate PowerPoint template.
To get around this, we found that adding a shape in PowerPoint behind your Power BI add-in can help create the feeling of intended disjointedness, which allows you to go over corporate template without risking looking unprofessional.
3. “Include my changes” creates a shared view that expires in 180 days
According to Microsoft’s documentation on sharing a filtered Power BI report, when you share a filtered view of a report in Power BI this view expires in 180 days. Luckily, each time the link shared report view is accessed the expiration is reset for another 180 days. However, if your PowerPoint presentation is shelved with no activity for more than 180 days, you can expect that next time you open it all the report charts will have been reset to their default state.
4. You cannot remove the report title and page name from the Power BI add-in toolbar
This one is short and simple. Currently, you are stuck carrying the report title and page names with each Power BI report page you embed into PowerPoint. Be sure to give your report and pages appropriate titles (no Sales_Report_Final_v16 or Page1 please!).
5. “Show as Saved Image” still allows end users to re-click the button to connect to live report
When we learned that you could use the “Show as Saved Image” button to freeze your Power BI add-in we were very excited. This was potentially a very useful feature for B2B scenarios, as we could share a PowerPoint presentation with folks outside our organization and they would be able to view the chart as an image.
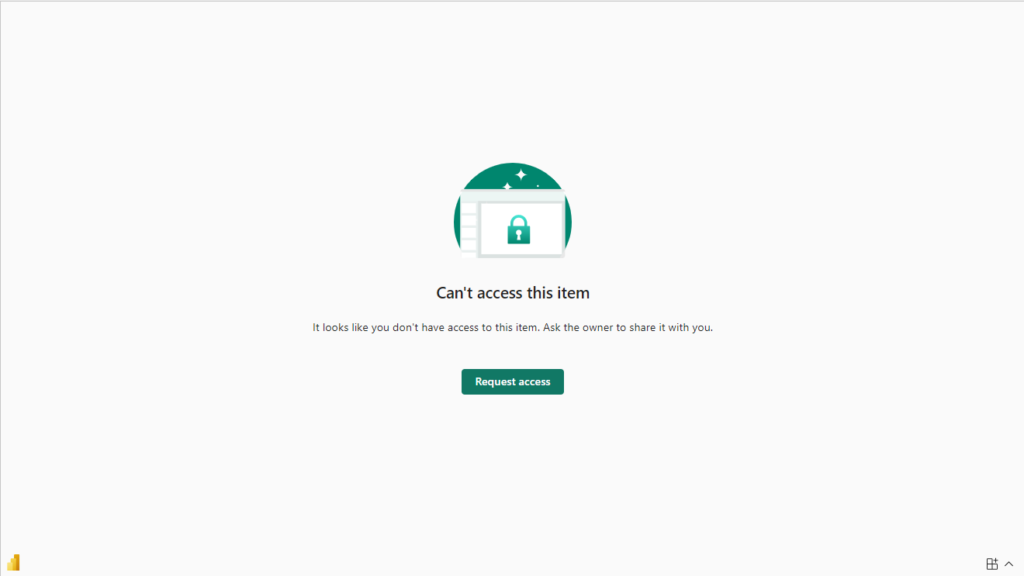
The disappointing news here is that, while you can do exactly what we mentioned above, the end user can still click the Power BI add-in (which looks like an image) and unclick “Show as Saved Image”. This action presents the end user with a “Can’t access this item” message and provides the user with the ability to Request access (see below). This quirk of the feature renders it essentially useless for the purpose we mention above.
Note: it is important to recognize that Storytelling with PowerPoint is still in Preview. This means that Microsoft is still perfecting this tool but has allowed users to take a sneak peek. Some or all of our considerations and limitations may be addressed by the time the integration becomes generally available. Nevertheless, these are the limitations at the time of publishing this blog post.
Limitations Aside, This Integration Rocks!
There is no software that is perfect. While we list out some key limitations of Storytelling with PowerPoint in the section above, we think this integration absolutely rocks and it is one of the top reasons to choose Power BI over other data visualization tools.
Microsoft makes it as easy as clicking a button from the Insert tab to bring in a connected Power BI report into your PowerPoint presentation. That is amazing!
The integration between Power BI and PowerPoint allows data storytellers to up their game and deliver insights in a more dynamic way. The ability to answer questions by drilling into your data without context transition is huge. This alone has the potential to drive much deeper conversations about the story your data is telling and lead to better decisions being made all around.
If you haven’t begun telling your data stories using Storytelling with PowerPoint, we highly recommend and would love to know what you think.

![Read more about the article [How To] Connect to Web Data Sources in Power BI](https://goanalyticsbi.com/wp-content/uploads/2023/01/Connect-to-web-data-sources-in-Power-BI-300x157.png)
![Read more about the article [How To] Align single value card visual in Power BI](https://goanalyticsbi.com/wp-content/uploads/2021/01/Align-Card-Visual-300x157.png)