Understanding Data Types in Power Query (Power BI & Excel)
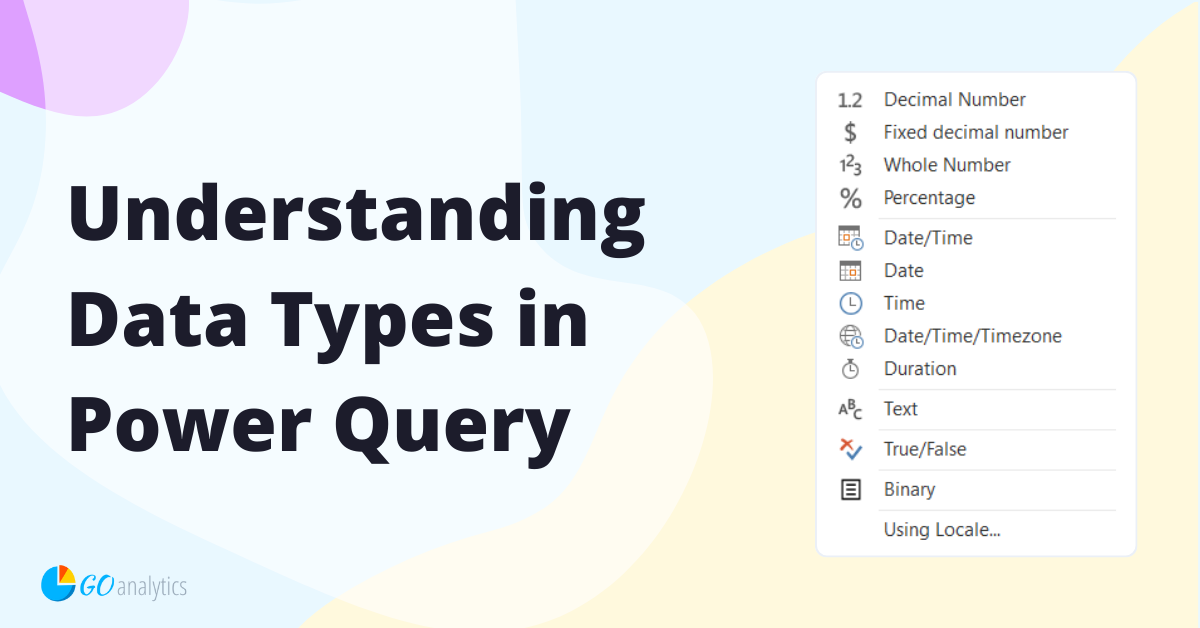
One critical factor that significantly impacts the performance and accuracy of your Power BI reports is the data types used in your datasets. In this blog post, we delve into the world of data types in Power Query (Power BI & Excel), their importance and how to manage them effectively.


![Read more about the article [How To] Change Data Source Location in Power Query](https://goanalyticsbi.com/wp-content/uploads/2023/07/Change-Source-Data-Location.png)
![Read more about the article Introduction to Power Query: What Is It? [2023]](https://goanalyticsbi.com/wp-content/uploads/2023/04/Intro-to-Power-Query.png)
![Read more about the article [How To] Remove Unwanted Columns in Power Query Editor](https://goanalyticsbi.com/wp-content/uploads/2023/03/Remove-unwanted-columns-in-PQ.png)