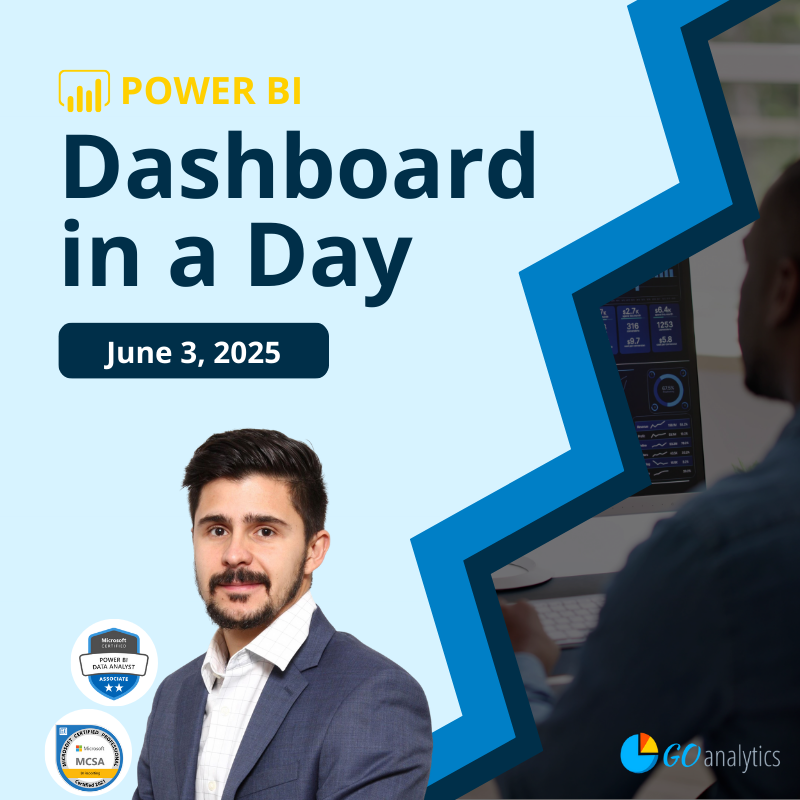
Personalized 1:1 Power BI Training [Deposit]
$1,875.00
Personalized 1:1 Power BI Training
- Trainer: Klayton Gonçalves, Microsoft Certified Power BI Specialist
- Delivery Method: Microsoft Teams
- Sessions Recordings: Provided for future reference
- Duration: 3 sessions per week, 1.5 hours per session
- Schedule: To be determined
Description
Personalized 1:1 Power BI Training
- Trainer: Klayton Gonçalves, Microsoft Certified Power BI Specialist
- Delivery Method: Microsoft Teams
- Sessions Recordings: Provided for future reference
- Duration: 3 sessions per week, 1.5 hours per session
![]()
Training Overview
This customized one-to-one Power BI training will be tailored specifically to your organization’s (Carmel Cannabis) pertinent datasets. Over a series of interactive sessions, we will cover Power BI fundamentals, including introducing the suite of tools and any set up, data preparation, modelling, and visualization, and move into advanced Power BI functionalities such as DAX (Data Analysis Expressions) and creating dashboards. The goal is to empower you to harness Power BI to analyze, visualize, and share insights from any dataset.
![]()
Personalized Training for Your Data
To deliver a customized training, where your organizational data is used for training purposes, the trainer will require access to a sample of the dataset(s) to be used in training ahead of the start of training and a week to become familiar with the dataset(s). This will ensure the training sessions can be focused on specific scenarios relevant to your business needs.
![]()
Training Structure
Week 1: Introduction to Power BI & Data Connection
3 sessions (1.5 hours each)
Session 1: Introduction to Power BI
- Overview of Power BI Desktop and its interface.
- Exploring the Power Query Editor: how to access it, its purpose, and basic navigation.
- Understanding different data sources: connecting to Excel, CSV, SQL databases, and online data sources relevant to your dataset.
- Hands-on activity: Downloading and setting up Power BI Desktop, connecting to your primary data source, and managing data settings.
Session 2: Connecting & Managing Data
- Advanced data connection techniques, including dealing with data source errors.
- Introduction to data refresh strategies and best practices for data connection management.
- Hands-on activity: Connect to additional data sources (or secondary data tables) relevant to your dataset.
Session 3: Data Transformation 101
- Introduction to Power Query transformations: data types, filtering, and renaming columns.
- Exploring basic data transformations: removing rows/columns, replacing values, and handling null values.
- Hands-on activity: Perform transformations on your data, preparing it for analysis.
Week 2: Advanced Data Transformation & Introduction to DAX
3 sessions (1.5 hours each)
Session 4: Data Transformation Continued
- Advanced transformations: splitting and merging columns, pivoting/unpivoting, and grouping data.
- Hands-on activity: Apply advanced transformations on your dataset and review the impact on data quality.
Session 5: Data Modelling & Schemas
- Introduction to data modeling in Power BI: what it is, why it’s essential, and how to design effective data models.
- Working with schemas (i.e., star schema) and creating relationships between tables.
- Hands-on activity: Create a data model from your dataset and set up basic relationships.
Session 6: Introduction to DAX for Calculated Columns and Measures
- Basic DAX concepts and syntax: calculated columns vs. measures.
- Writing simple DAX functions to create calculated columns, using SUM, AVERAGE, COUNT, and other basic calculations.
- Hands-on activity: Create calculated columns and measures based on your data and review their utility for reporting.
Week 3: DAX for Measures & Intermediate Data Modelling
3 sessions (1.5 hours each)
Session 7: Intermediate DAX Functions
- Introduction to measures: understanding when to use calculated columns vs. measures.
- Exploring DAX functions, such as CALCULATE, ALL, and FILTER, and how they apply in different business scenarios.
- Hands-on activity: Create a series of measures relevant to your reporting needs.
Session 8: Time Intelligence Functions in DAX
- Overview of time intelligence in DAX and why it’s useful.
- Using DATEADD, DATESYTD, SAMEPERIODLASTYEAR, and other date-related functions to build time-based insights.
- Hands-on activity: Apply time intelligence functions to analyze trends in your data over time.
Session 9: Advanced Data Modelling
- Working with complex data models, relationship cardinality, and direction.
- Best practices for managing and optimizing data models.
- Hands-on activity: Optimize your data model and set up role-level security if applicable.
Week 4: Data Visualization in Power BI
3 sessions (1.5 hours each)
Session 10: Basics of Data Visualization
- Principles of effective data visualization and storytelling.
- Setting up report pages, formatting visualizations, and importing custom themes.
- Hands-on activity: Design a report page based on key metrics and KPIs from your dataset.
Session 11: Interactive Visualizations
- Adding slicers, filters, and buttons to create interactive dashboards.
- Using charts, maps, and tables to present data effectively.
- Hands-on activity: Enhance your report with interactive elements, such as slicers and filters, based on your business needs.
Session 12: Advanced Visualization Techniques
- Using bookmarks, creating dynamic titles, and applying conditional formatting.
- Setting up custom tooltips and other advanced visual features.
- Hands-on activity: Build out advanced visualizations using custom tooltips, conditional formatting, and bookmarks.
Week 5: DAX for Measures & Intermediate Data Modelling
2 sessions (1.5 hours each)
Session 13: Publishing & Sharing in Power BI Service
- Introduction to Power BI Service: creating and managing workspaces.
- Publishing reports and creating dashboards.
- Hands-on activity: Publish your report to the Power BI Service and share it with relevant stakeholders.
Session 14: Final Review & Q&A
- Overview of role-level security, setting up report refresh schedules, and managing permissions.
- Final review of key concepts, Q&A, and additional tips for ongoing Power BI development.
- Hands-on activity: Set up a workspace in Power BI Service, explore role-level security options, and wrap up with a recap of best practices.
![]()
Deliverables
- Training Sessions: 1.5-hour sessions, 3 times per week.
- Training Materials: Access to session recordings, additional resources, and DAX and M code cheat sheets.


![Personalized 1:1 Power BI Training [Deposit]](https://goanalyticsbi.com/wp-content/uploads/2024/10/Personlized-Training.png)